
Dashboard Overview
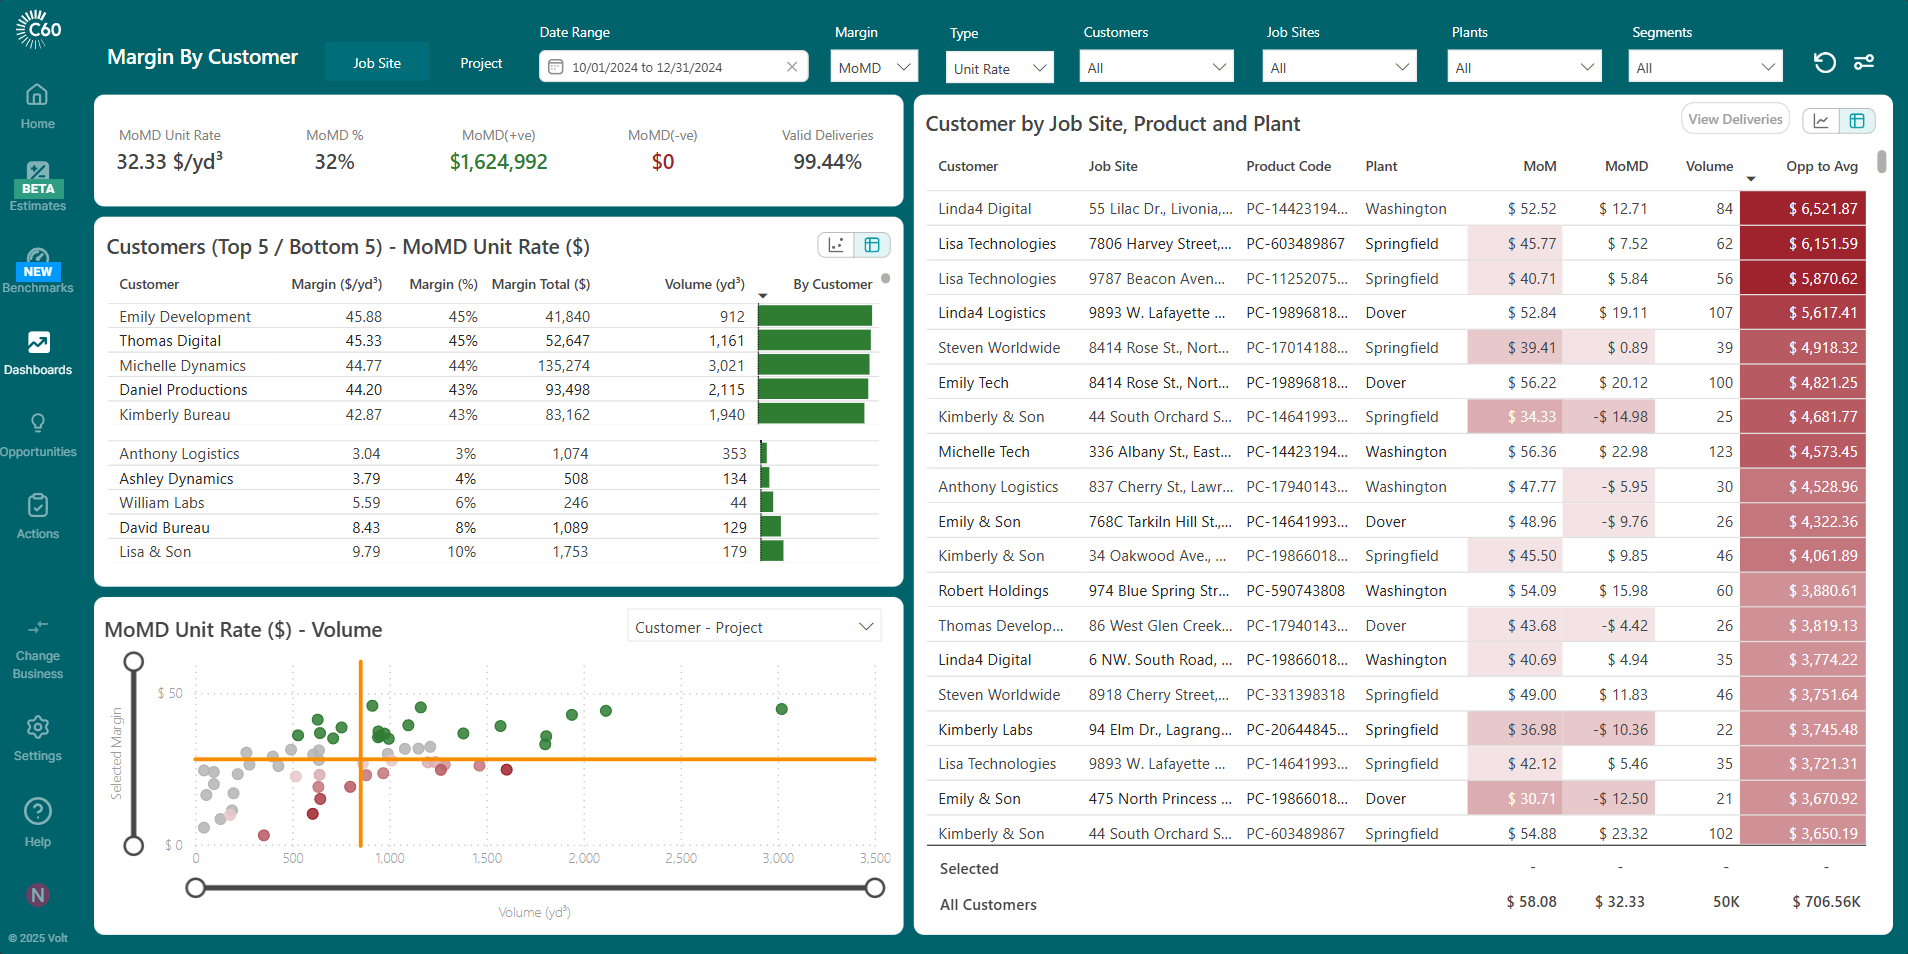
Enterprise Summary

MoMD Unit Rate (Margin on Material after Delivery)
The average margin generated per yard after accounting for the material cost of the products sold and the delivery cost.
MoMD %
The percentage of margin generated after accounting for the material cost of the products sold and the delivery cost.
MoMD (+ve)
The sum of the total margin generated from all customers with a positive net margin.
MoMD (-ve)
The sum of total margin generated from all customers with a negative net margin.
Valid Deliveries
The percentage of deliveries that were included in margin dashboard.
In order for C60 to calculate a margin on a delivery, there must be a valid revenue, material cost and delivery cost.
Ex. If the material cost of all products sold on a delivery is not populated or is equal to $0. C60 will exclude this delivery in the Margin by Customer dashboard.
Customer (Top 5 / Bottom 5) - MoMD Unit Rate ($)
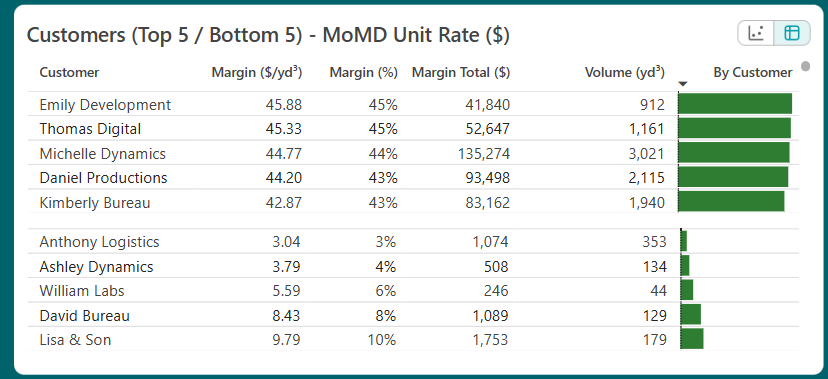
Customer
Customer Name.
Margin ($/yd³)
Customer average margin generated per yard.
Margin (%)
Customer average margin %.
Margin Total ($)
The customers total revenue generated.
Volume (yd³)
Volume delivered in the date range selected.
By Customer
Visual representation of the unit margin rate.
The longer the bar, the higher the margin unit rate.
Green bar represents a positive unit margin rate.
Red bar represents a negative unit margin rate.
Customer by Job Site, Product and Plant
Can be altered to be viewed by project instead of job site.
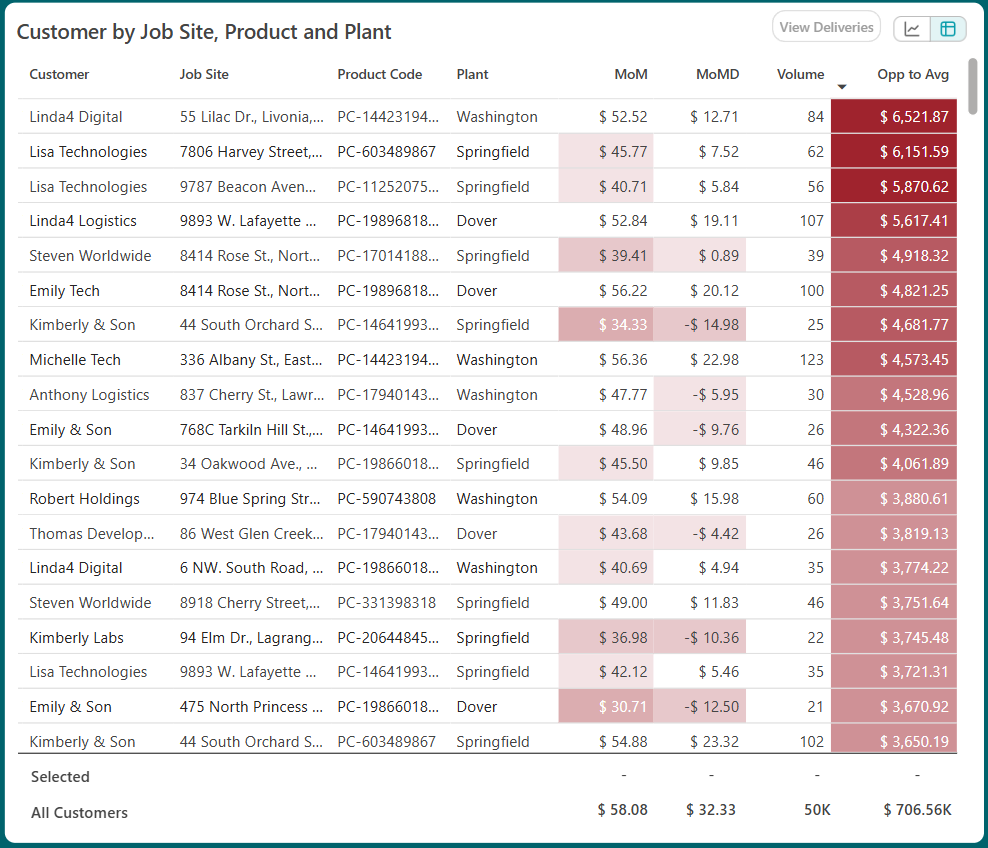 Customer
Customer name.
Job Site
Job site or delivery address.
Product Code
Mix design code.
Plant
Plant name.
MoM
Margin on material unit rate.
MoMD
Margin on material and delivery unit rate.
Volume
Delivered volume.
Opp to Avg
The estimated opportunity if the MoMD of the combination of customer, job site, product and plant were to match the enterprise average.
Ex. In this demo environment, the average MoMD is $32.33/y³. The top opportunity in the table is Linda4 Digital at $6,521.87. This is calculated by taking the difference between the MoMD for Linda4 Digital at $12.71/y³ and the business average of $32.33/y³ and multiplying it by the volume sold (84y³) and then annualizing this value based on the time period selected.