
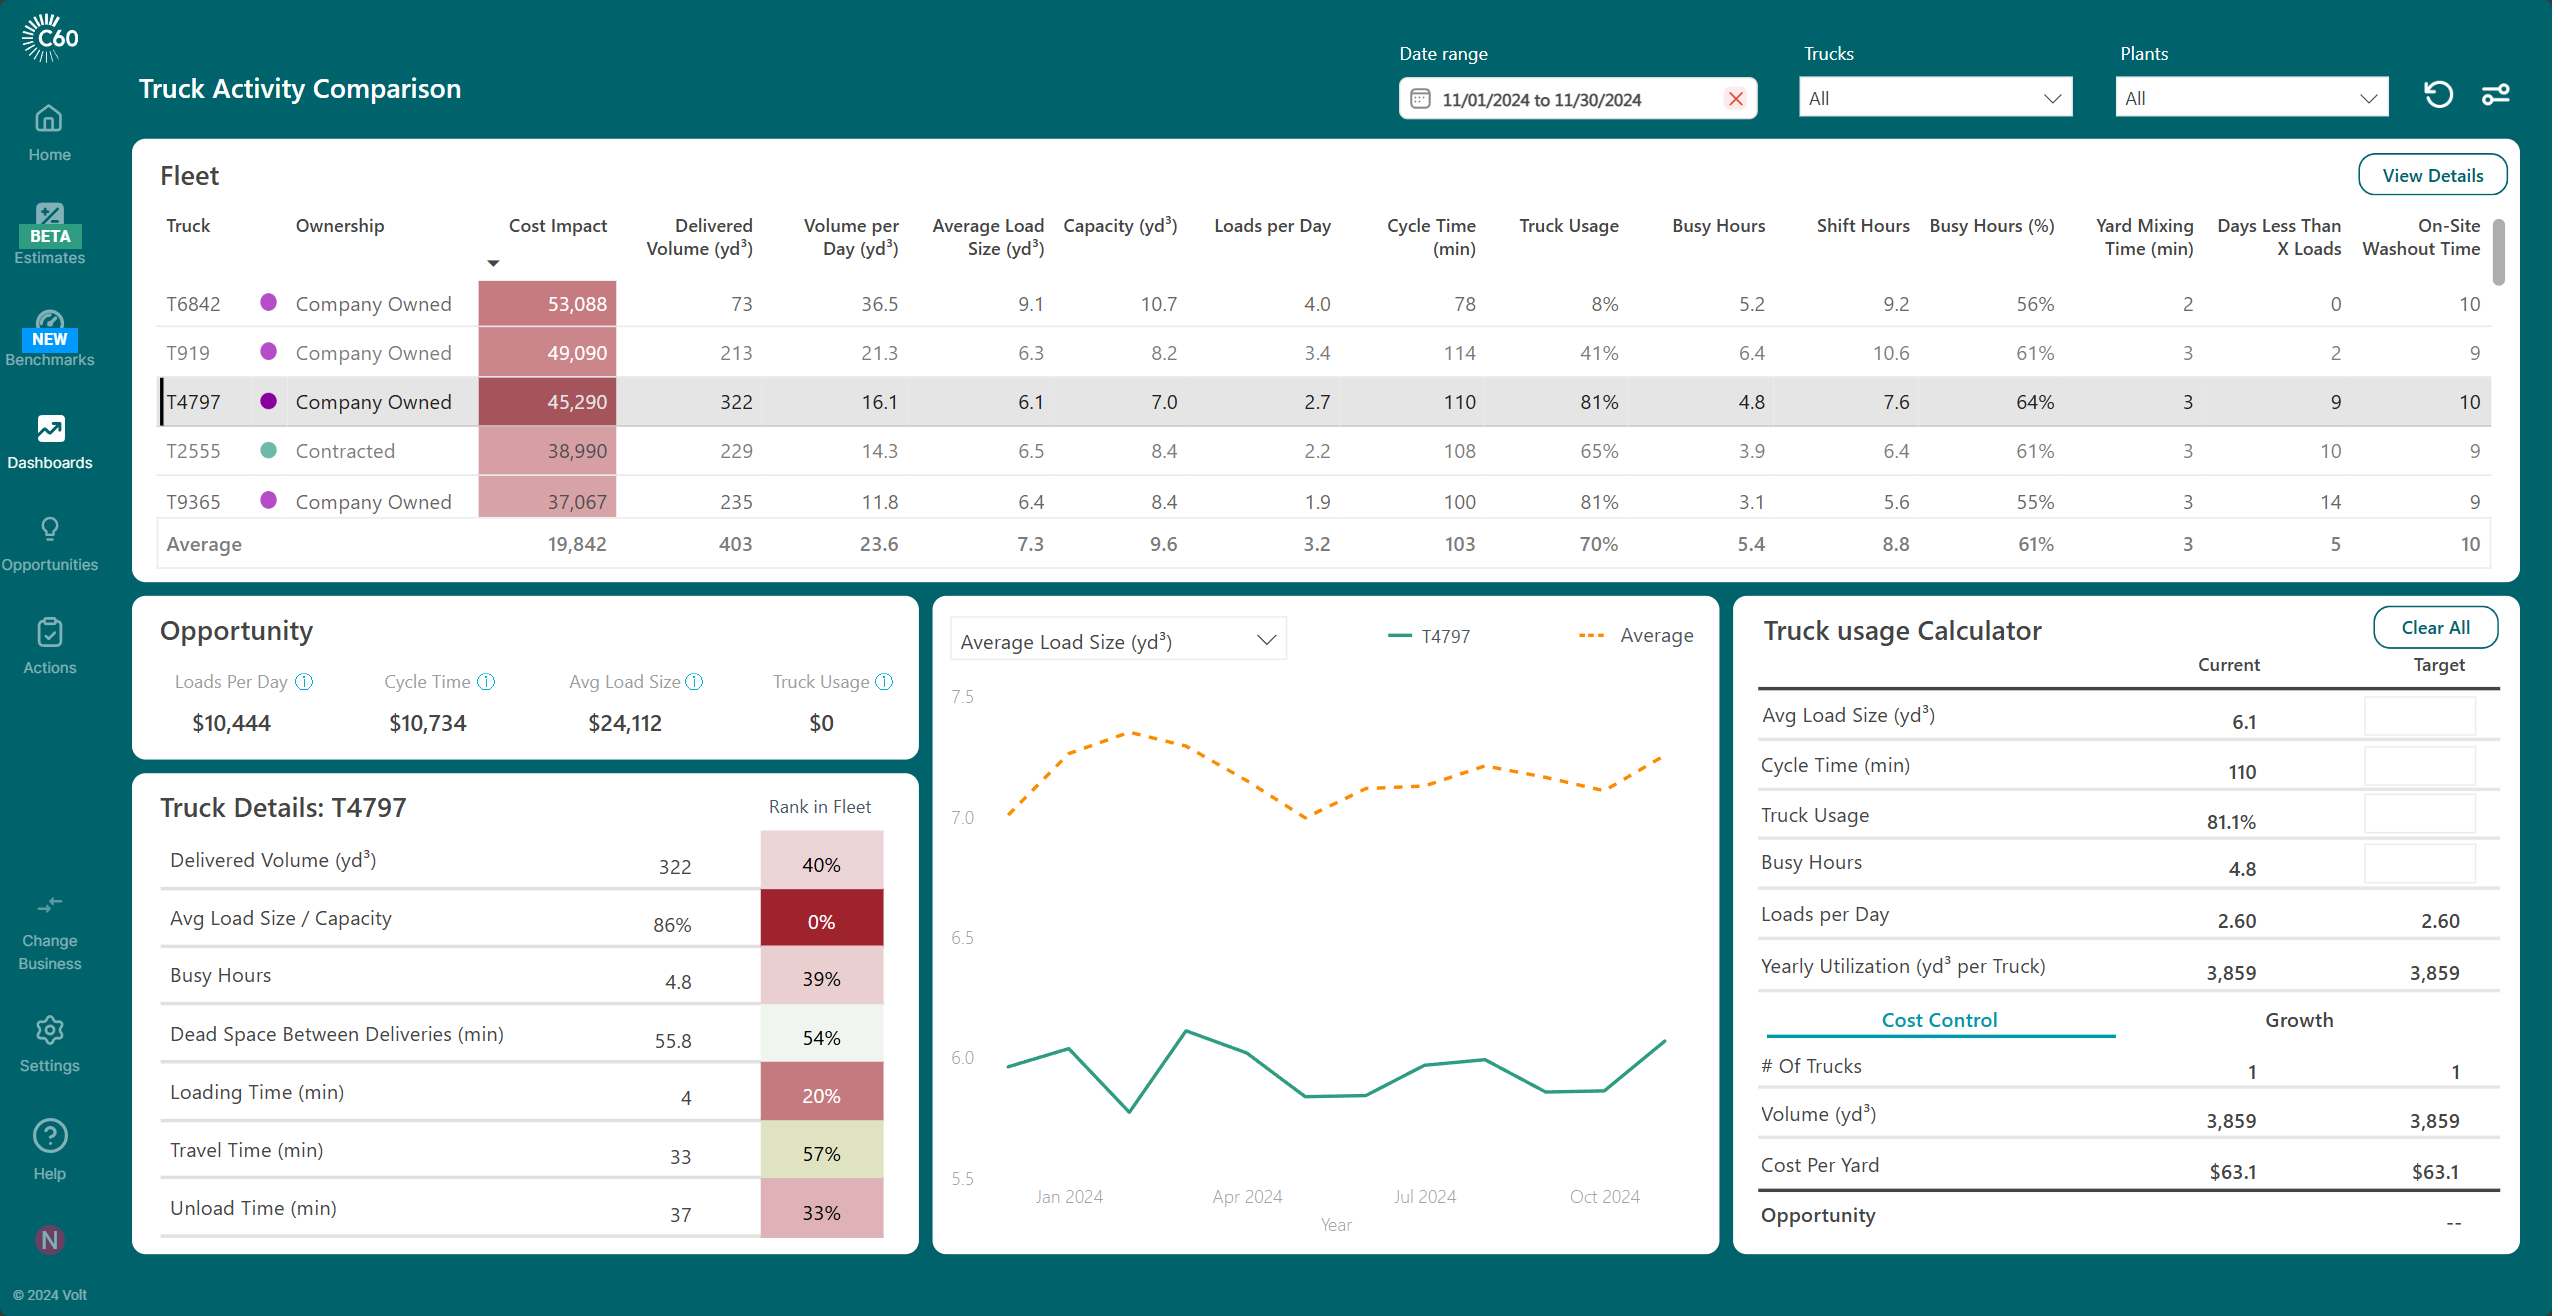
Fleet Table Metrics
Truck
The truck code, hover over the code to display the truck name if available.
Ownership
Ownership represents whether the asset or truck is company owned, contracted or rented. This is determined from a specific parameter assigned to your individual trucks that C60 then maps to an ownership type in the settings. The parameter used is dependent on which dispatch system is used.
Cost Impact
The annualized cost impact of improving the truck utilization which C60 refers to as the amount of volume delivered per year. This field is calculated using your inputted truck cost and four key metrics that yield the highest utilization; truck usage, average load size, cycle time and loads per day.
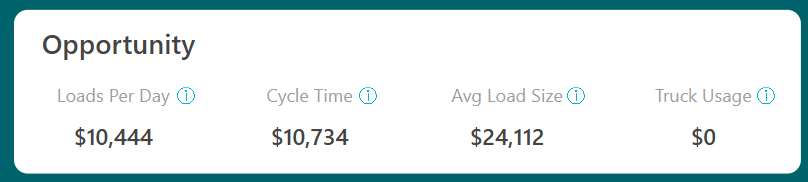
When selecting a truck, you will see the opportunity value calculated by comparing the big four metrics of the individual truck to the fleet average. In the example below, truck T4797 has a lower loads per day, cycle time and average load size when compared to the fleet average. Therefore, the opportunity value displayed is the impact of improving each metric to the fleet average. Since truck usage is higher for truck T4797, there is no calculated opportunity.

Delivered Volume (yd3)
Volume delivered over the reporting period selected.
Volume per Day (yd3)
The average volume delivered per day the truck was in use.
Average Load Size (yd3)
Average load size over the time period selected.
Capacity (yd3)
The max capacity of the truck. This based on the largest load delivered in the last calendar year.
Loads per Day
The average loads delivered per working day.
Cycle Time (min)
Average cycle time based off the loading, travel and on-site time of all deliveries during the time period selected.
Truck Usage (%)
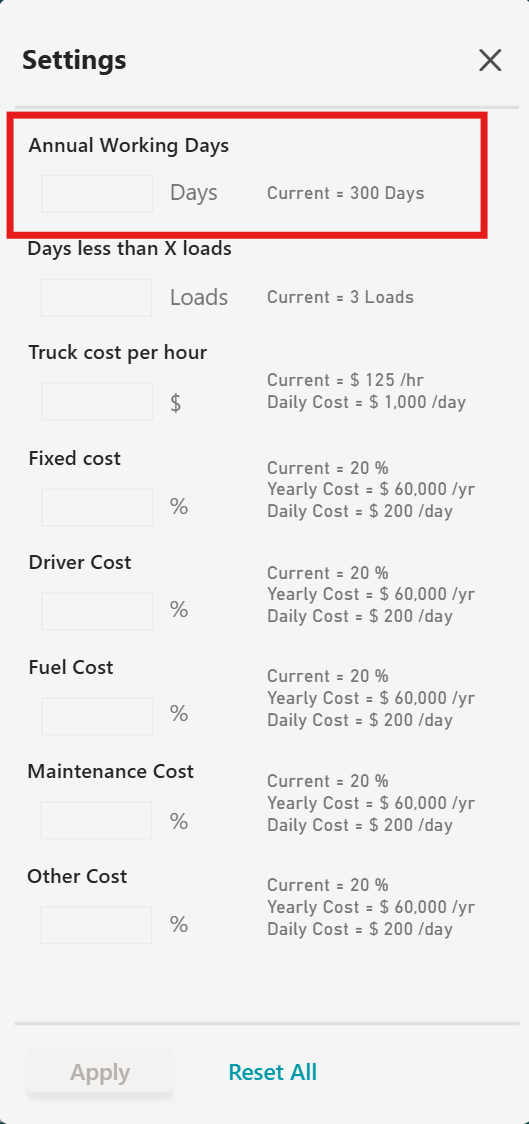
The percentage of days the truck was actively delivering concrete vs the total amount of working days defined in the settings.
You can view or temporarily change the number of working days by selecting the settings icon.
Example: If the annual working days is set to 300 days (this equates to ~25 available workings days a month) and a truck actively delivers concrete on 5 days in the month of November, the usage becomes 5/25 = 20%.
Busy Hours
The daily average duration the truck was actively ticketed and delivering a load.
Truck Shift Hours
The daily average total duration from the beginning of the first load to the completion of the last delivery.
Busy Hours (%)
The percentage of truck shift hours spent actively hauling deliveries.
Yard Mixing Time (min)
The average time between batch completion to the truck leaving the plant.
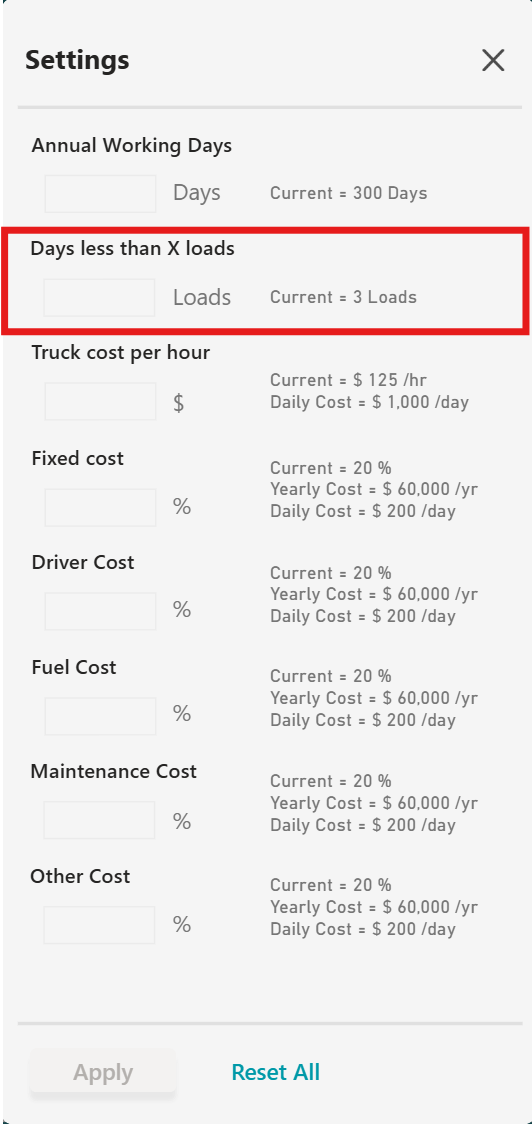
Days Less Than X Loads
The number of days in the date range selected that the truck delivered less than X loads. X is defined in the settings of the dashboard.
On-Site Washout Time (min)
The average time between finish unloading concrete to leaving the job site.
Truck Details Metrics
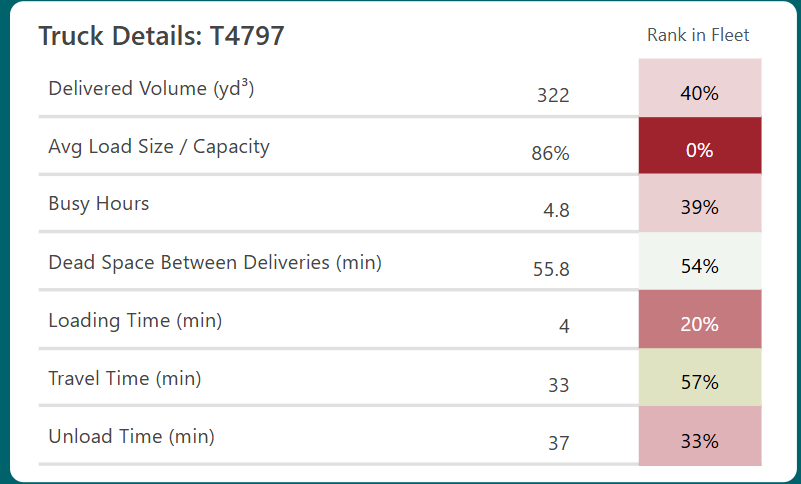
Rank in Fleet
Refers to the positional rank of the truck in comparison to the fleet.
Delivered Volume (yd3)
Volume delivered over the reporting period selected.
Avg Load Size/Capacity (%)
The percentage of the average load size in comparison to the truck capacity.
Busy Hours (%)
The percentage of truck shift hours spent actively hauling deliveries.
Dead Space Between Deliveries (min)
The average time between the completion of one delivery to the start of the next.
Loading Time (min)
The average loading time from start load to leave plant.
Travel Time (min)
The average travel time to the job site.
Unload Time (min)
The average unloading duration.