
Why Volume Doesn't Always Match Across Your C60 Dashboards
Each C60 dashboard is built to answer a different business question, so each applies its own default volume filters. This is expected and not a data error. Three filters drive most differences: cancelled orders, pickup/FOB tickets, and (for margin dashboards only) delivery validity.
|
Cancelled Volume Volume tied to orders or tickets that were cancelled. Excluded by default everywhere except Order Activity Tracker, which is built specifically to surface cancellations and their frequency. |
Pickup / FOB Volume Volume picked up by the customer at the plant, with no delivery cost to producer. Included in margin dashboards (pickup margins can differ) and delivery-cost dashboards typically exclude it, since there is no delivery cost to measure. |
Valid / Invalid Deliveries Applies only to margin dashboards. A delivery is “invalid” when revenue or material cost data is missing or inaccurate, so margin can't be reliably calculated. Invalid deliveries are excluded by default so margin reflects more trustworthy data. |
Default Volume Filters by Dashboard
All dashboards include delivered (trucked) volume by default.
|
Dashboard |
Cancelled Volume |
Pickup / FOB Volume |
Valid/Invalid Filter* |
|
Margin by Customer |
Excluded |
Included |
Applies |
|
Margin by Product |
Excluded |
Included |
Applies |
|
Sales Analyzer |
Excluded |
Included |
Applies |
|
Customer Scorecard |
Excluded |
Excluded |
Applies |
|
Customer Cost of Service |
Excluded |
Excluded |
N/A |
|
Customer Churn |
Excluded |
Included |
N/A |
|
Customer Delivery Performance |
Excluded |
Excluded |
N/A |
|
Order Activity Tracker |
Included |
Excluded |
N/A |
|
Smart Pricing |
Excluded |
Included |
N/A |
|
Demand Spread Index |
Excluded |
Excluded |
N/A |
|
Truck Activity Comparison |
Excluded |
Excluded |
N/A |
|
Truck Usage |
Excluded |
Excluded |
N/A |
|
Status Accuracy |
Excluded |
Excluded |
N/A |
|
Driver Productivity |
Excluded |
Excluded |
N/A |
|
Batching Accuracy |
Excluded |
Included |
N/A |
|
Design Yield |
Excluded |
Included |
N/A |
|
Performance Analyzer |
Excluded |
Excluded |
N/A |
Using the Settings Panel to Compare Volumes
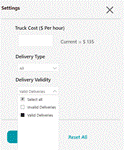
Every margin dashboard has a settings panel  (gear icon, top right) with two filters that let you adjust the volume shown: Delivery Type and Delivery Validity. These are the same filters described on the previous page, this panel is where you view or change them.
|
1. Open Settings |
2. Delivery Type filter |
3. Delivery Validity filter |
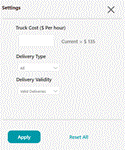
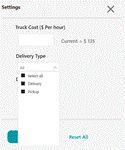
Delivery Type — defaults to “All.” Switch it to “Delivery” or “Pickup” to isolate one type of volume. This is how you include or exclude pickup/FOB volume within a margin dashboard.
Delivery Validity — defaults to “Valid Deliveries.” Change it to “Select all” (or add “Invalid Deliveries”) to see total volume inclusive of invalid deliveries, useful for reconciling against dashboards that don't apply a validity filter.
Example: a customer with a $50/yd³ average margin and a 75% valid delivery rate has its margin calculated on that 75% of volume — the remaining 25% is flagged invalid and excluded by default (view invalid deliveries anytime to see why, e.g. missing cost or revenue data).
Caution: Including invalid deliveries runs the risk of margin metrics being incomplete or inaccurate, since revenue and/or material cost data for those tickets is missing or unreliable. Use this view to reconcile volume totals, not as the basis for margin or pricing decisions.