
Dashboards
Benchmarks Dashboard is live!
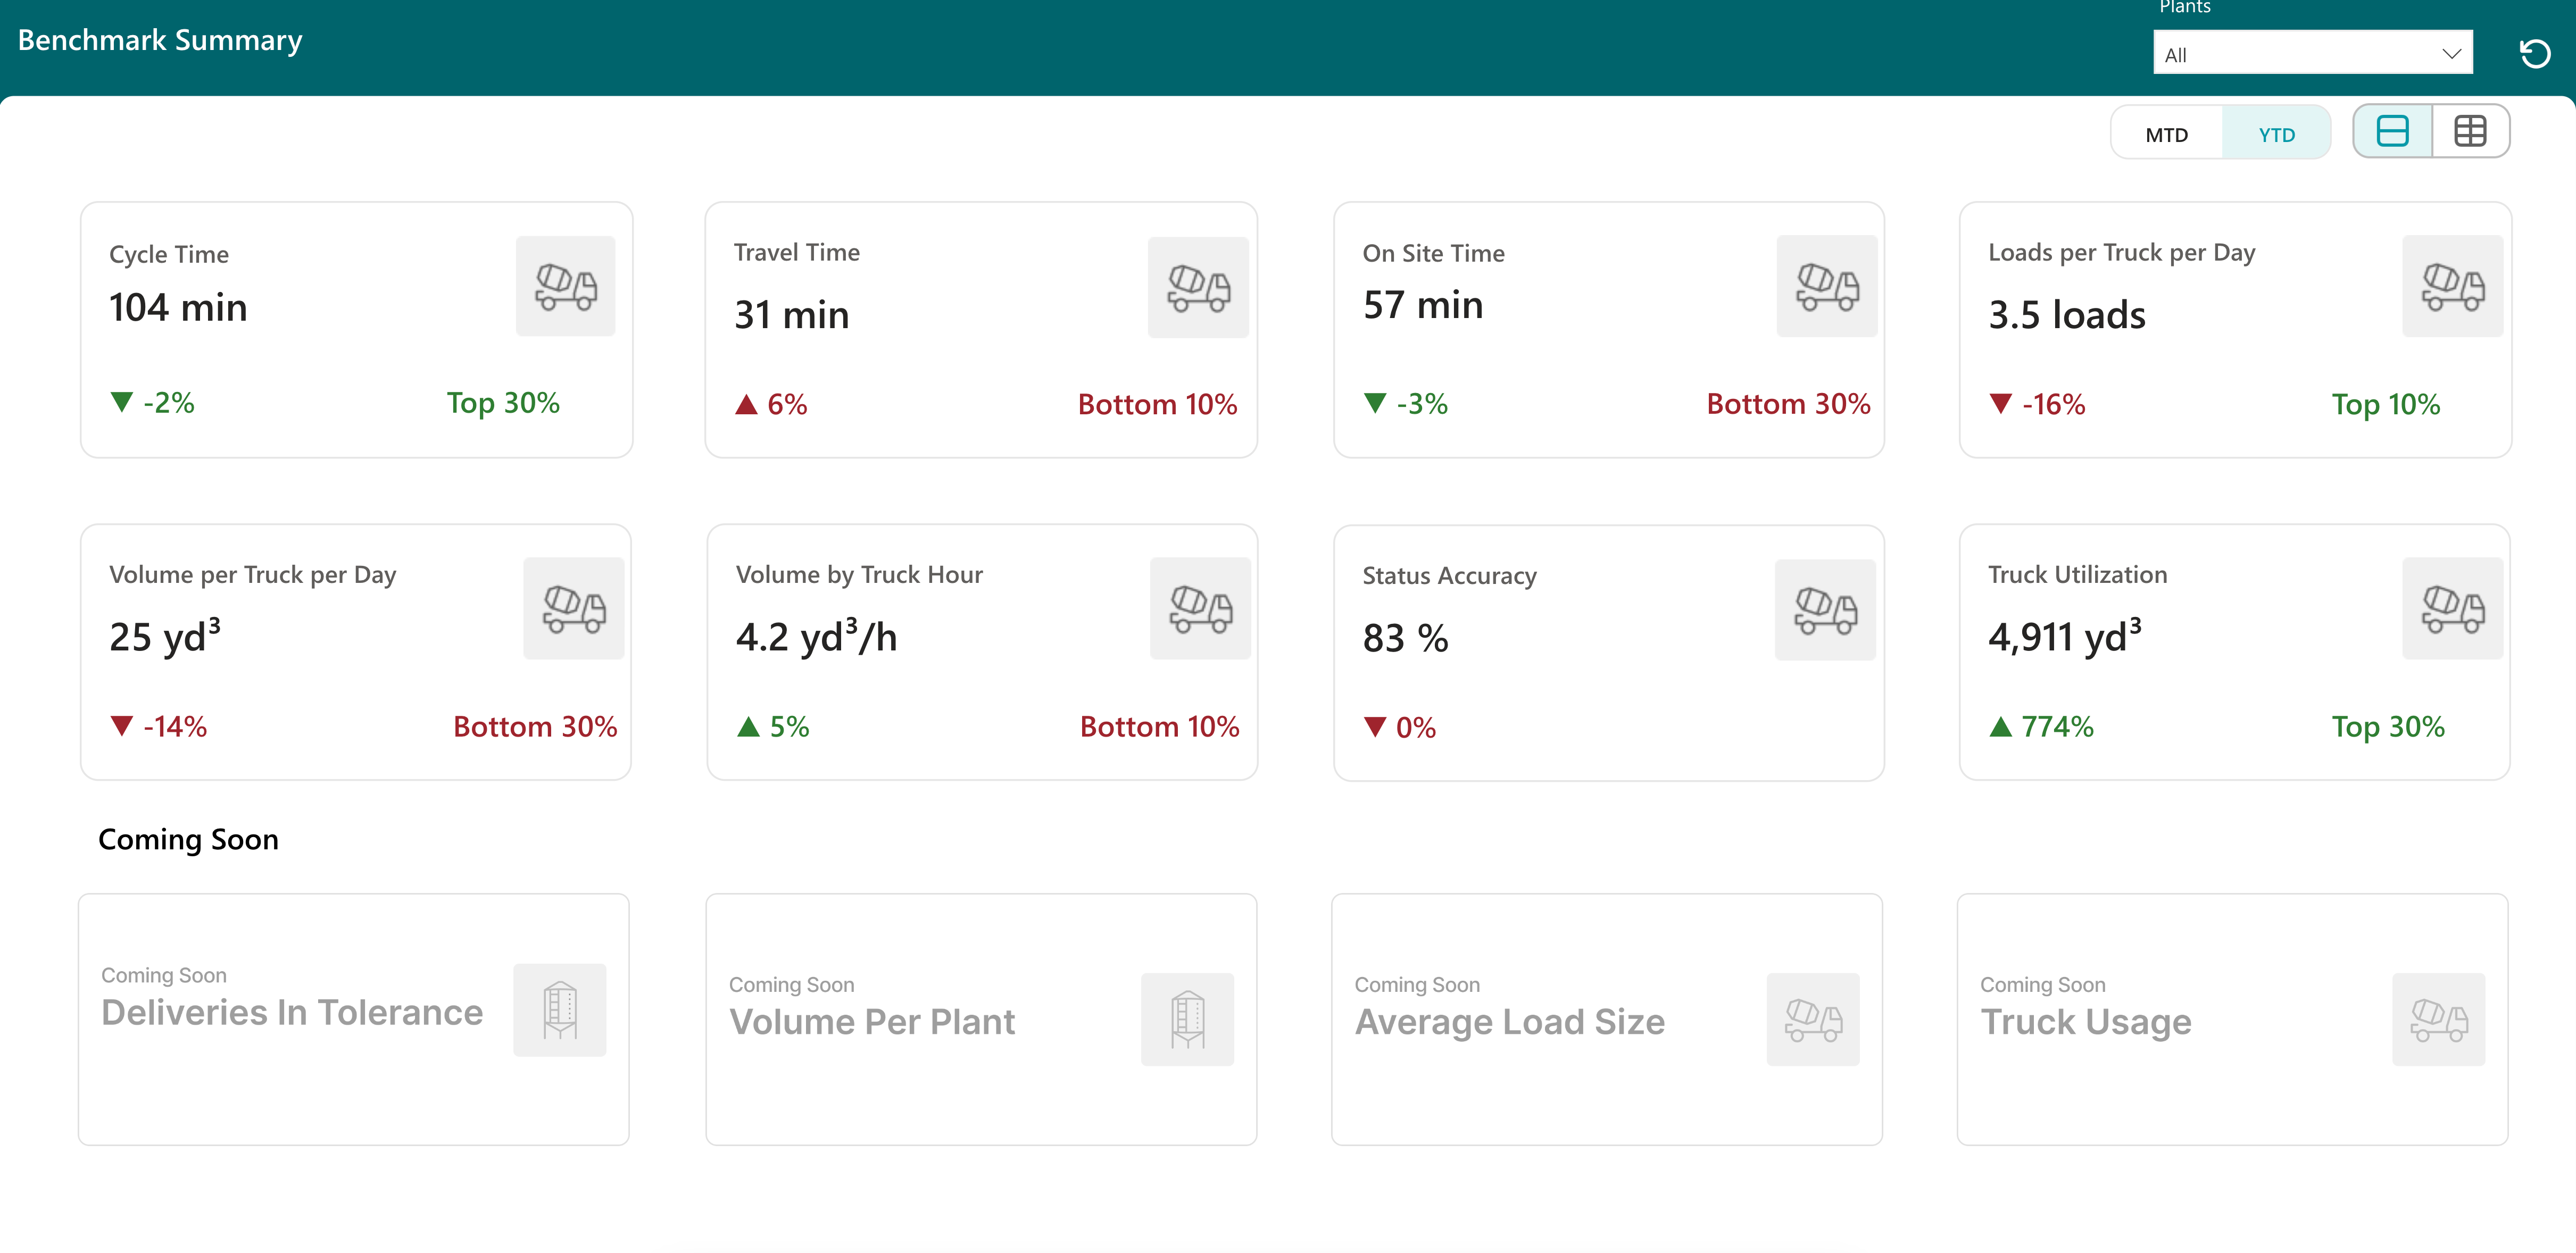
- The Benchmarks Dashboard provides a comprehensive analysis of key operational and financial performance indicators, allowing concrete producers to benchmark their own performance against the industry. Contextualize your performance so that you can identify opportunities and prioritize challenges specific to your organization.
Project View is live in Customer Cost of Service, Margin by Customer & Sales Analyzer!
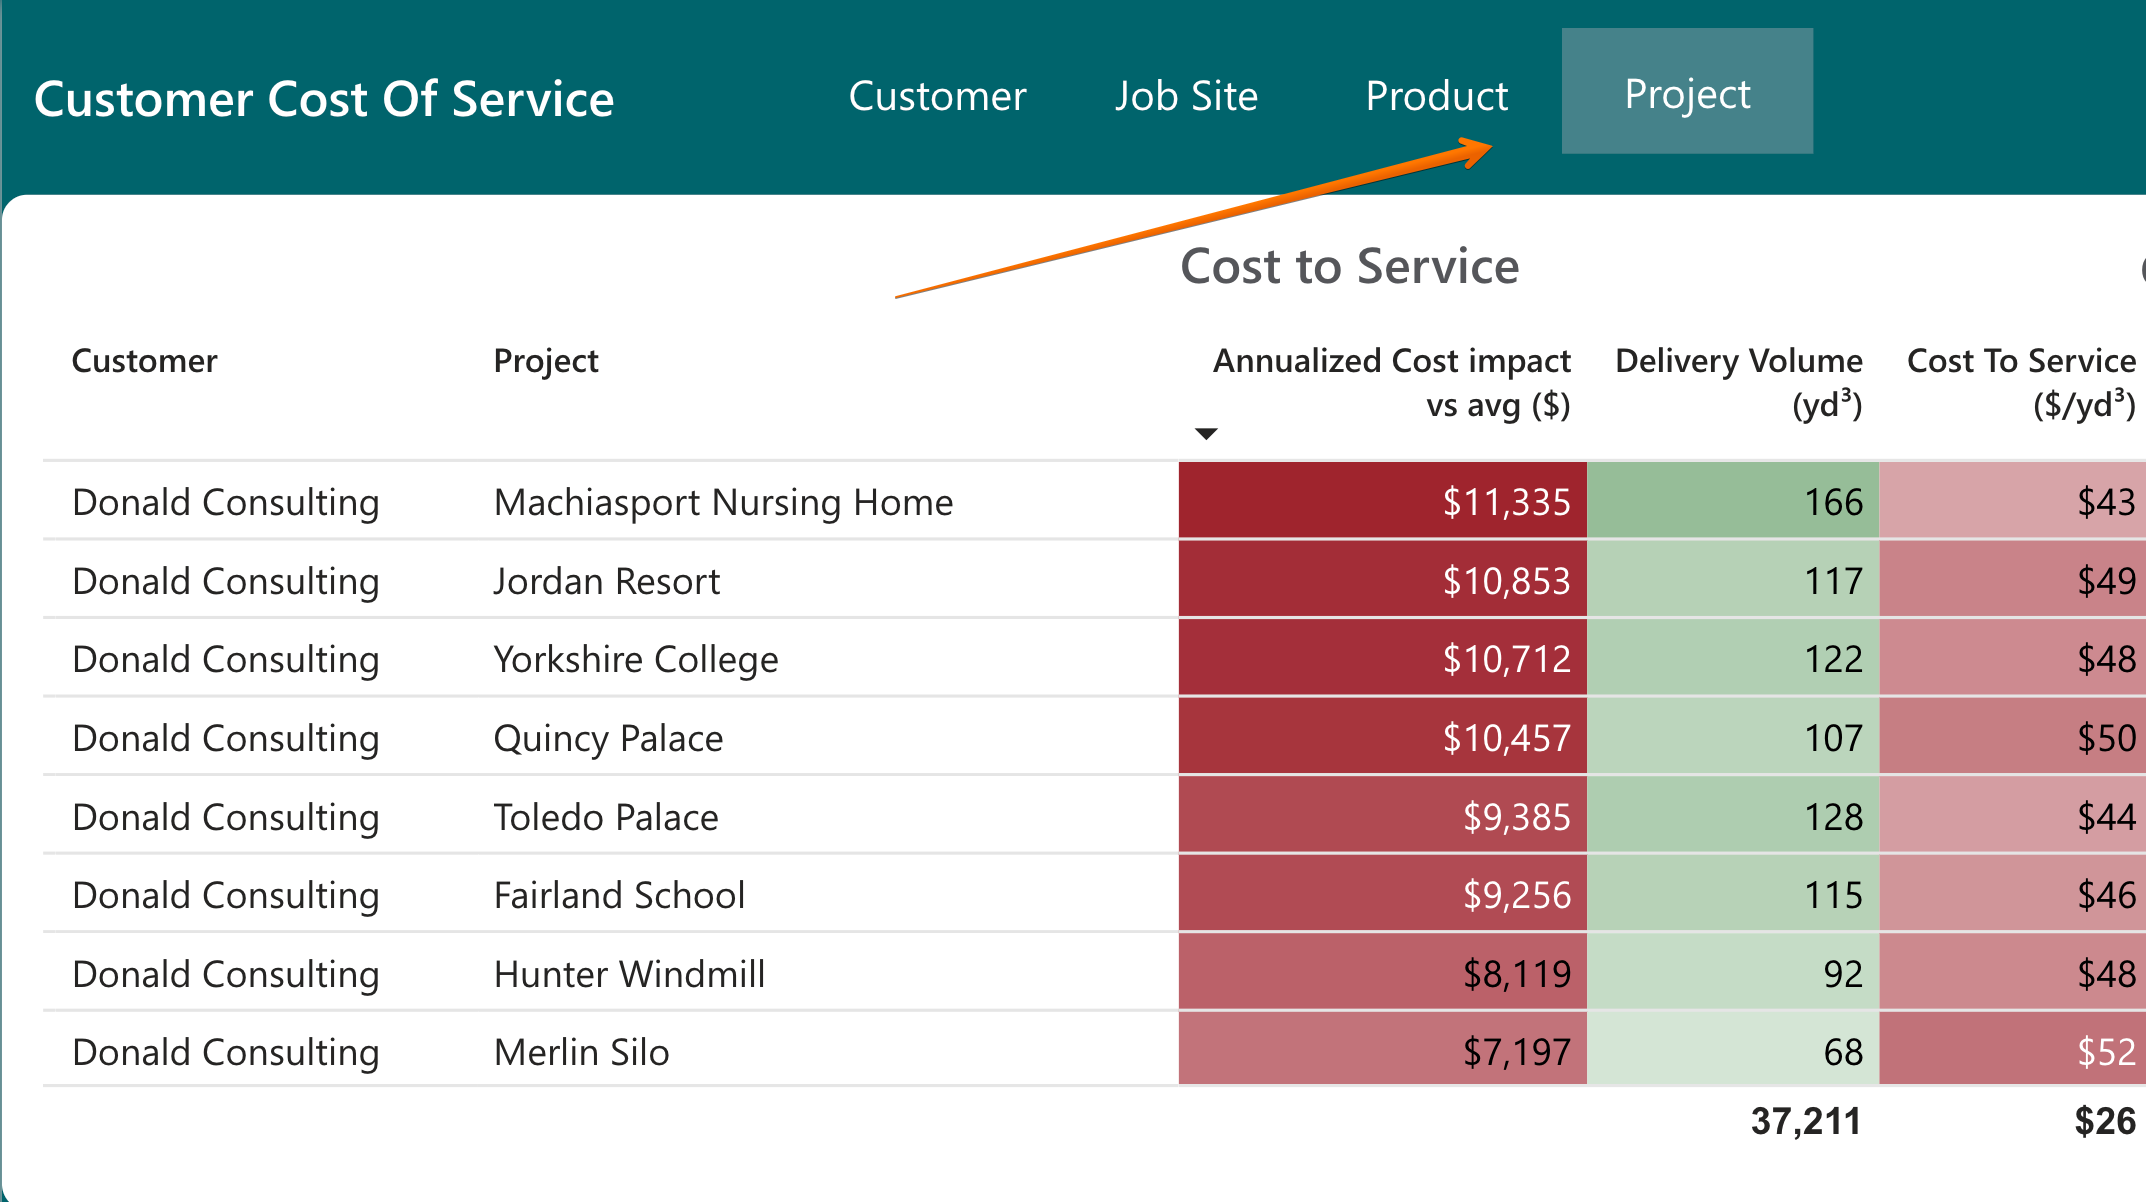
- You can now analyze data by project across three dashboards! The Project view is now available in the Customer Cost of Service, Margin by Customer, and Sales Analyzer dashboards. This enhancement empowers project owners to identify profitable projects and explore ways to enhance margins on the specific projects they oversee.
Delivery Details in Status Accuracy
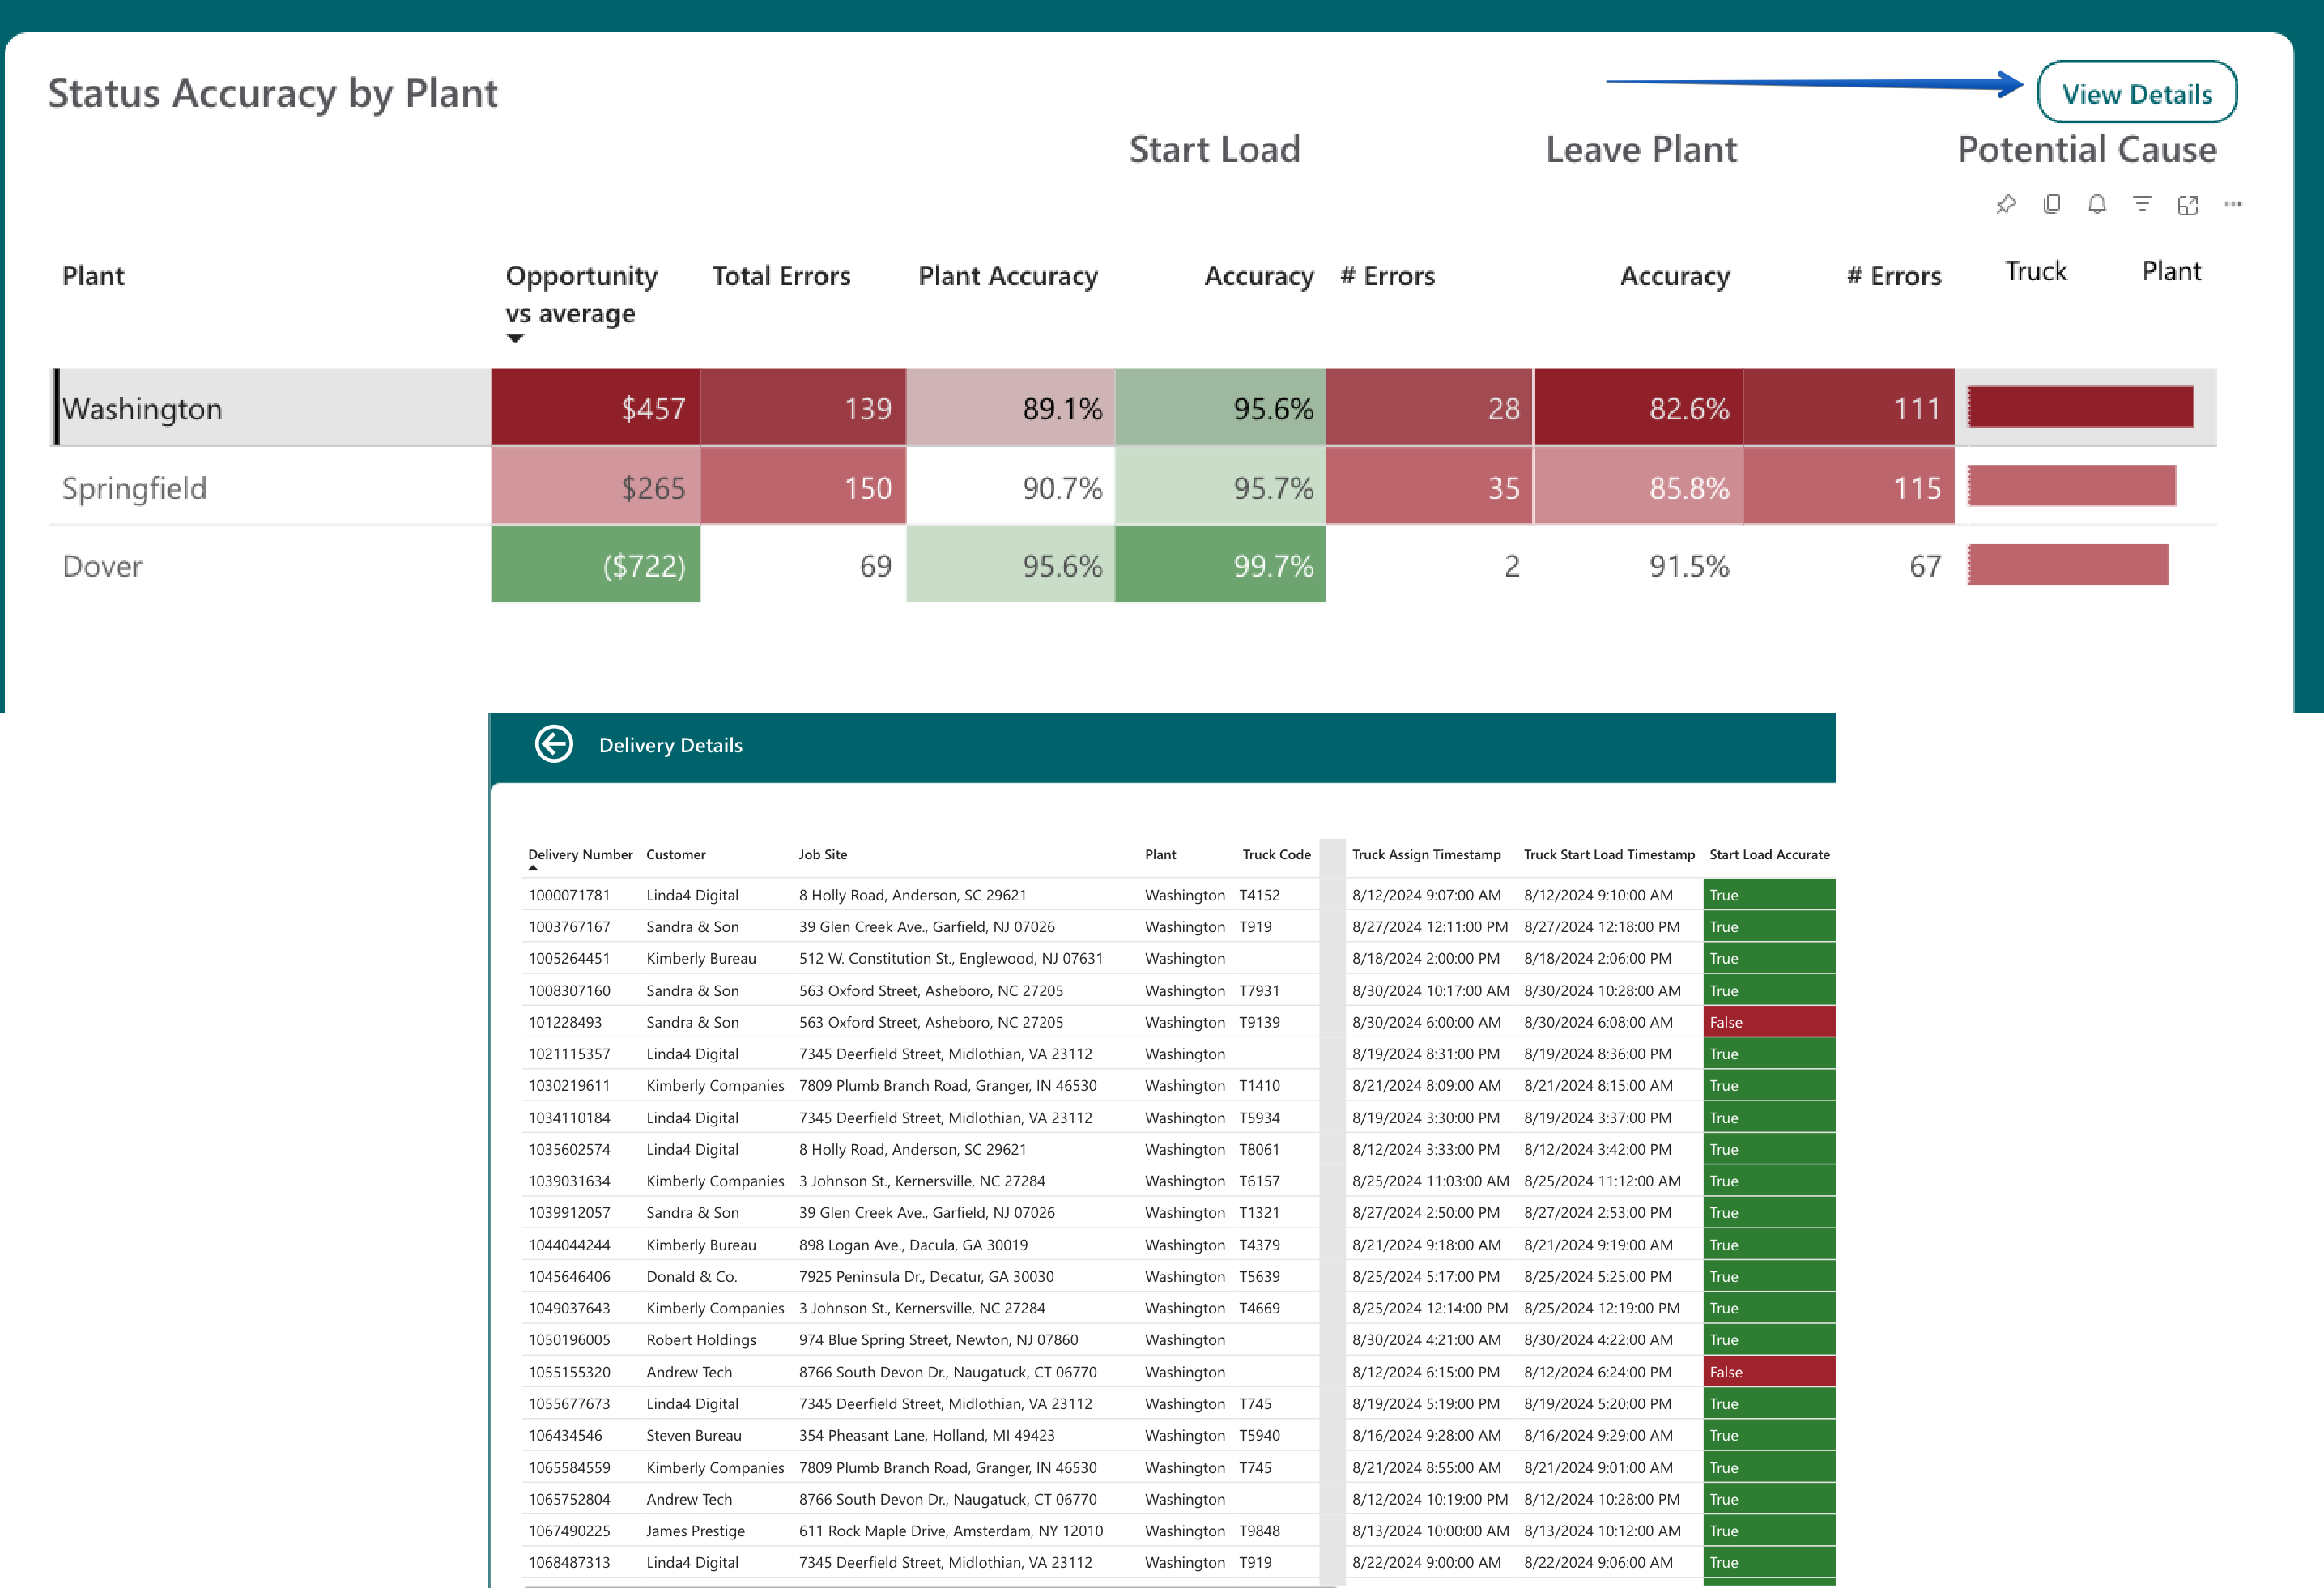
- Always wondered which deliveries are impacting your status accuracy? Click on view details and check the whole breakdown of which deliveries failed which status check!
Truck Usage: View by Truck Home Plant or Truck Delivery Plant
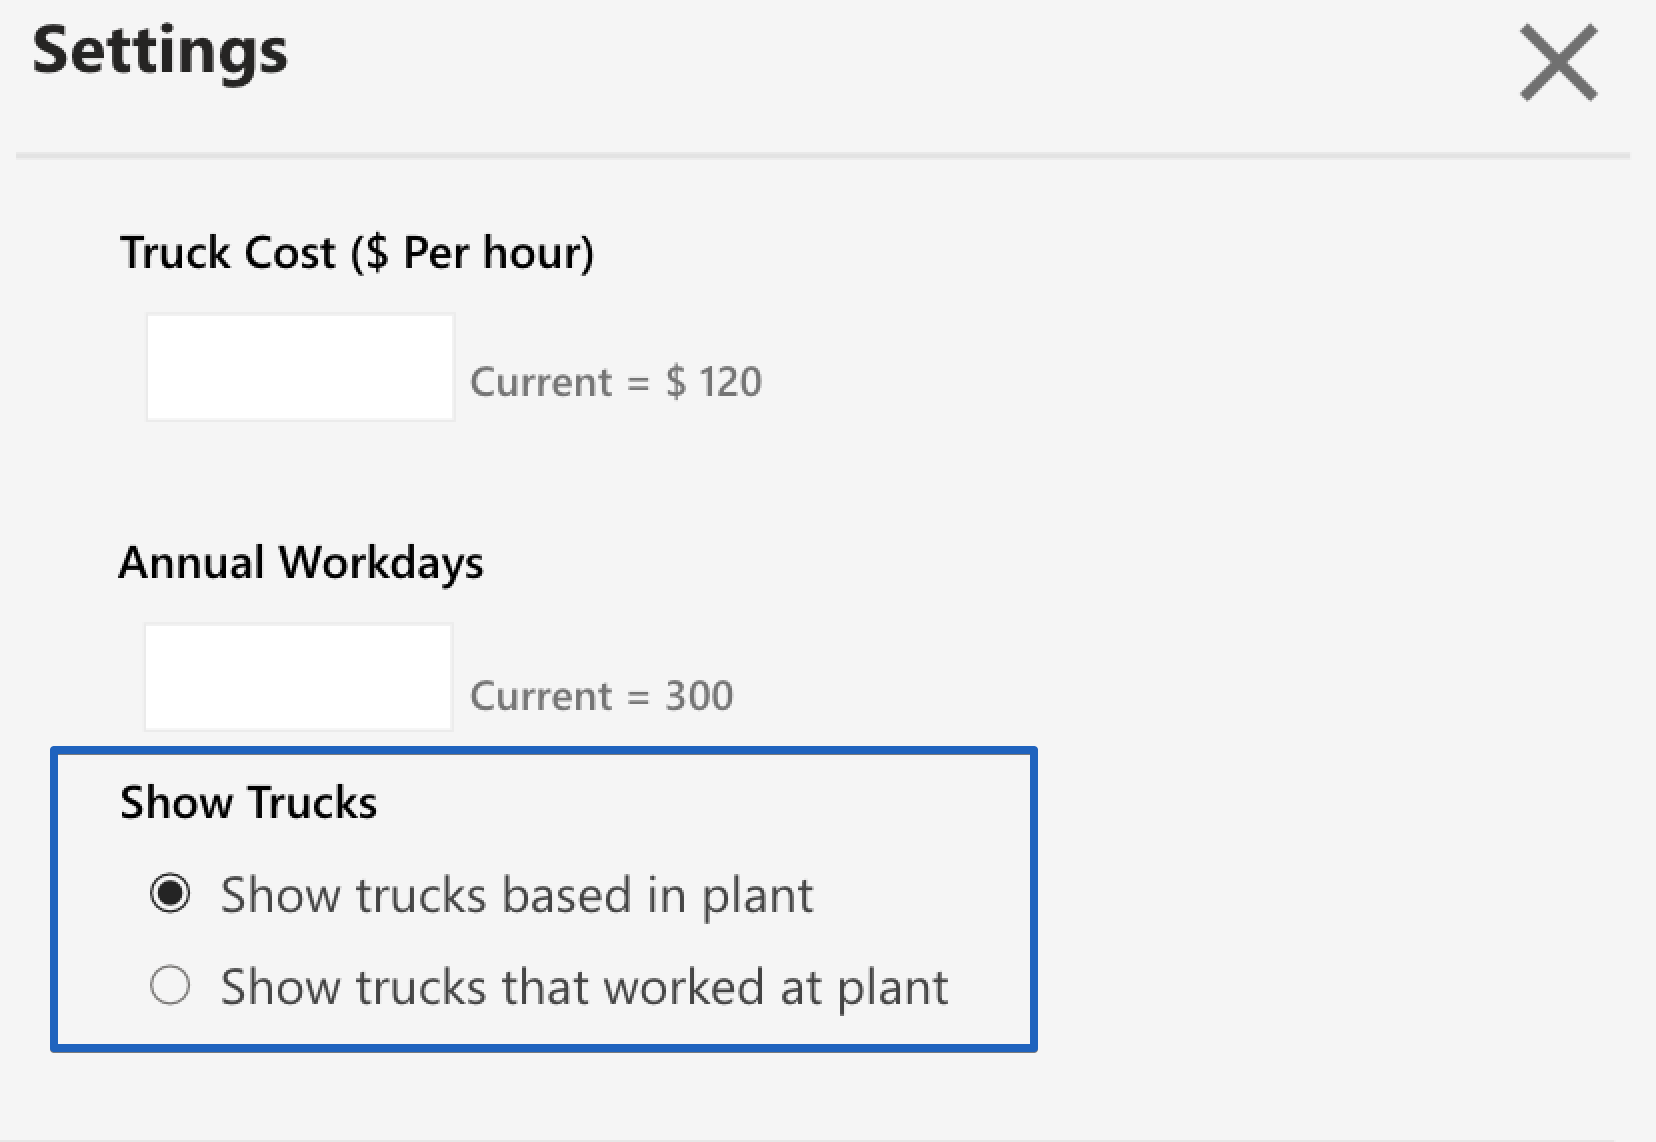
- In the Truck Usage Dashboard settings, you can now choose between 2 ways of interacting with the plant filter:
- View the trucks that are based at the plant (home plant). Useful to understand how trucks are used across all plants.
- View the trucks that worked at the plant (delivery plant). Useful to understand how specific plants use specific trucks, especially when trucks are shared across plants.
Customer Cost of Service: Added Peak Delivery Time
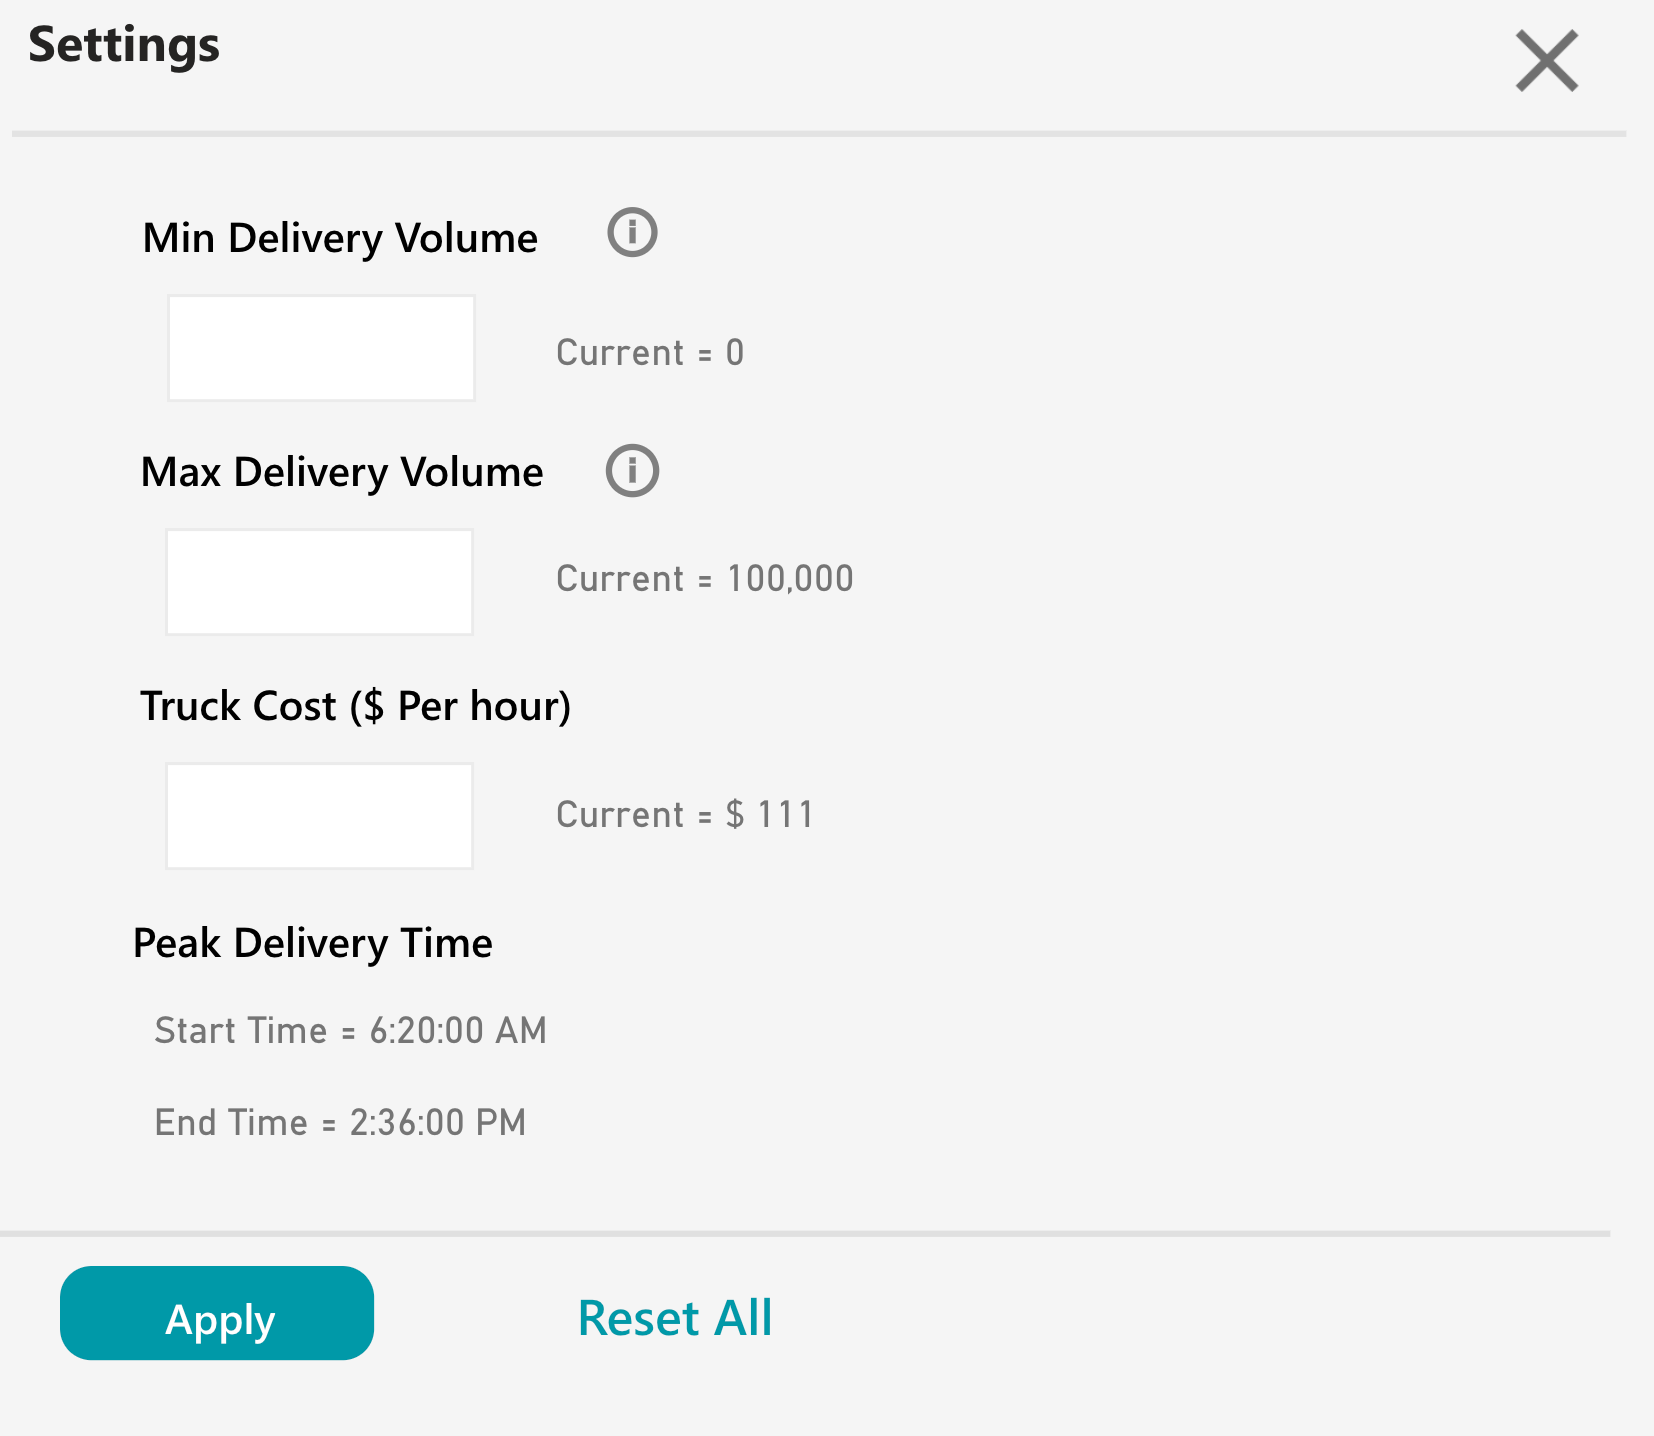
- The peak delivery time is now shown in the Customer Cost of Service settings to show more context around the dashboard.
🎢 Enhancements
- More precise opportunities with the enhanced capability to include or exclude individual products from margin calculations
- More precise opportunities in Customer Delivery Performance dashboard with logic refinement to handle missing timestamps
🐞Bug Fixes and Enhancements
- Units should now be converted & displayed properly in Batching Accuracy and Design Yield. This did not have an impact on calculations, but some settings were shown in the wrong units.
- Truck Activity Comparison widgets should not crash anymore when some timestamps are missing for a specific truck
- Fixes to handle customer data issues to avoid having duplicate deliveries information in dashboards
- Fixes to the logic to avoid delivery volumes across different dashboards