
Dashboards
Actual Travel Time used in Customer Cost of Service for greater precision!
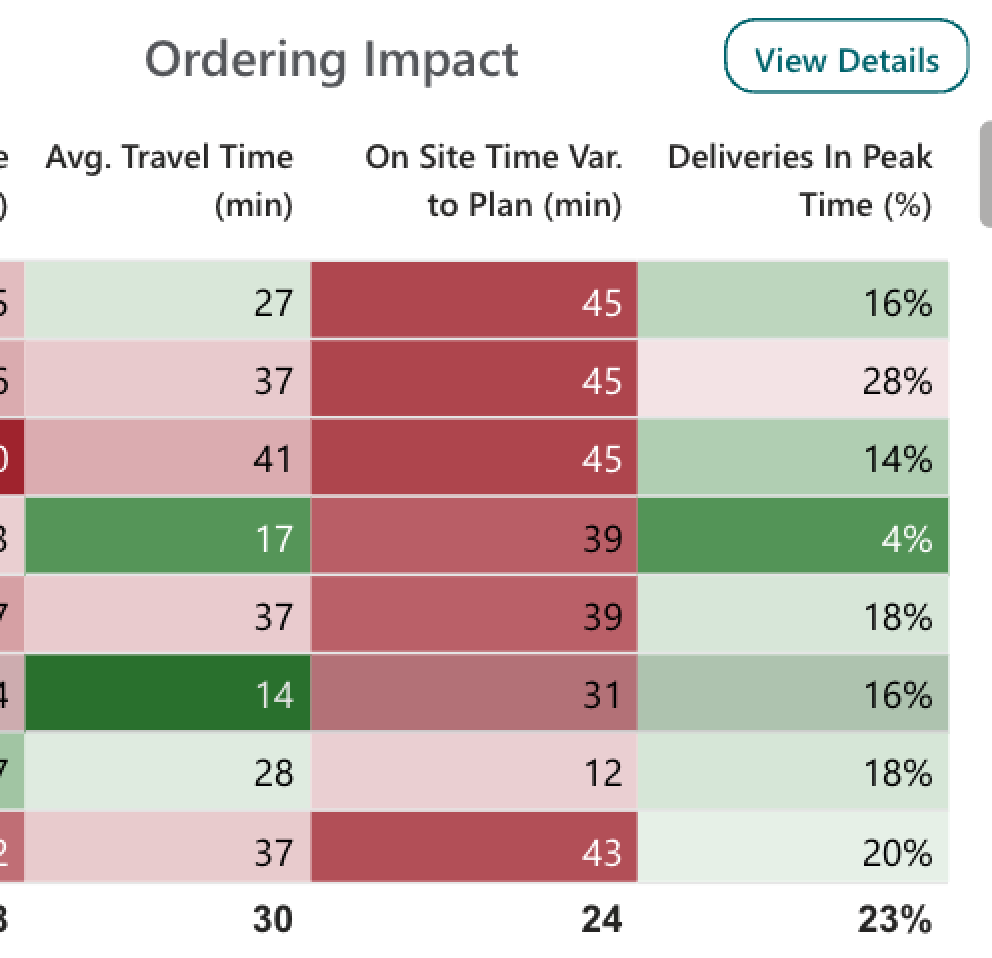
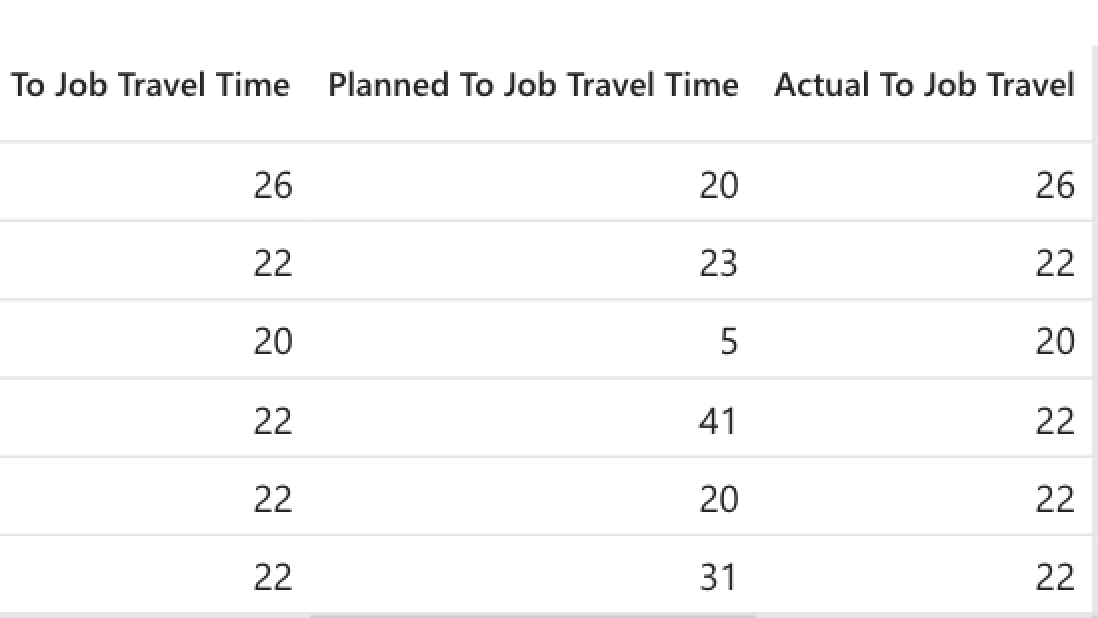
- We are now using the actual travel time in the cost of service for each customer. If the timestamps are inacurate, we use the average travel time from that plant, to that job site. If even that is not accurate, then we go back to using the planned travel time.
New Dashboard: Demand Spread Index
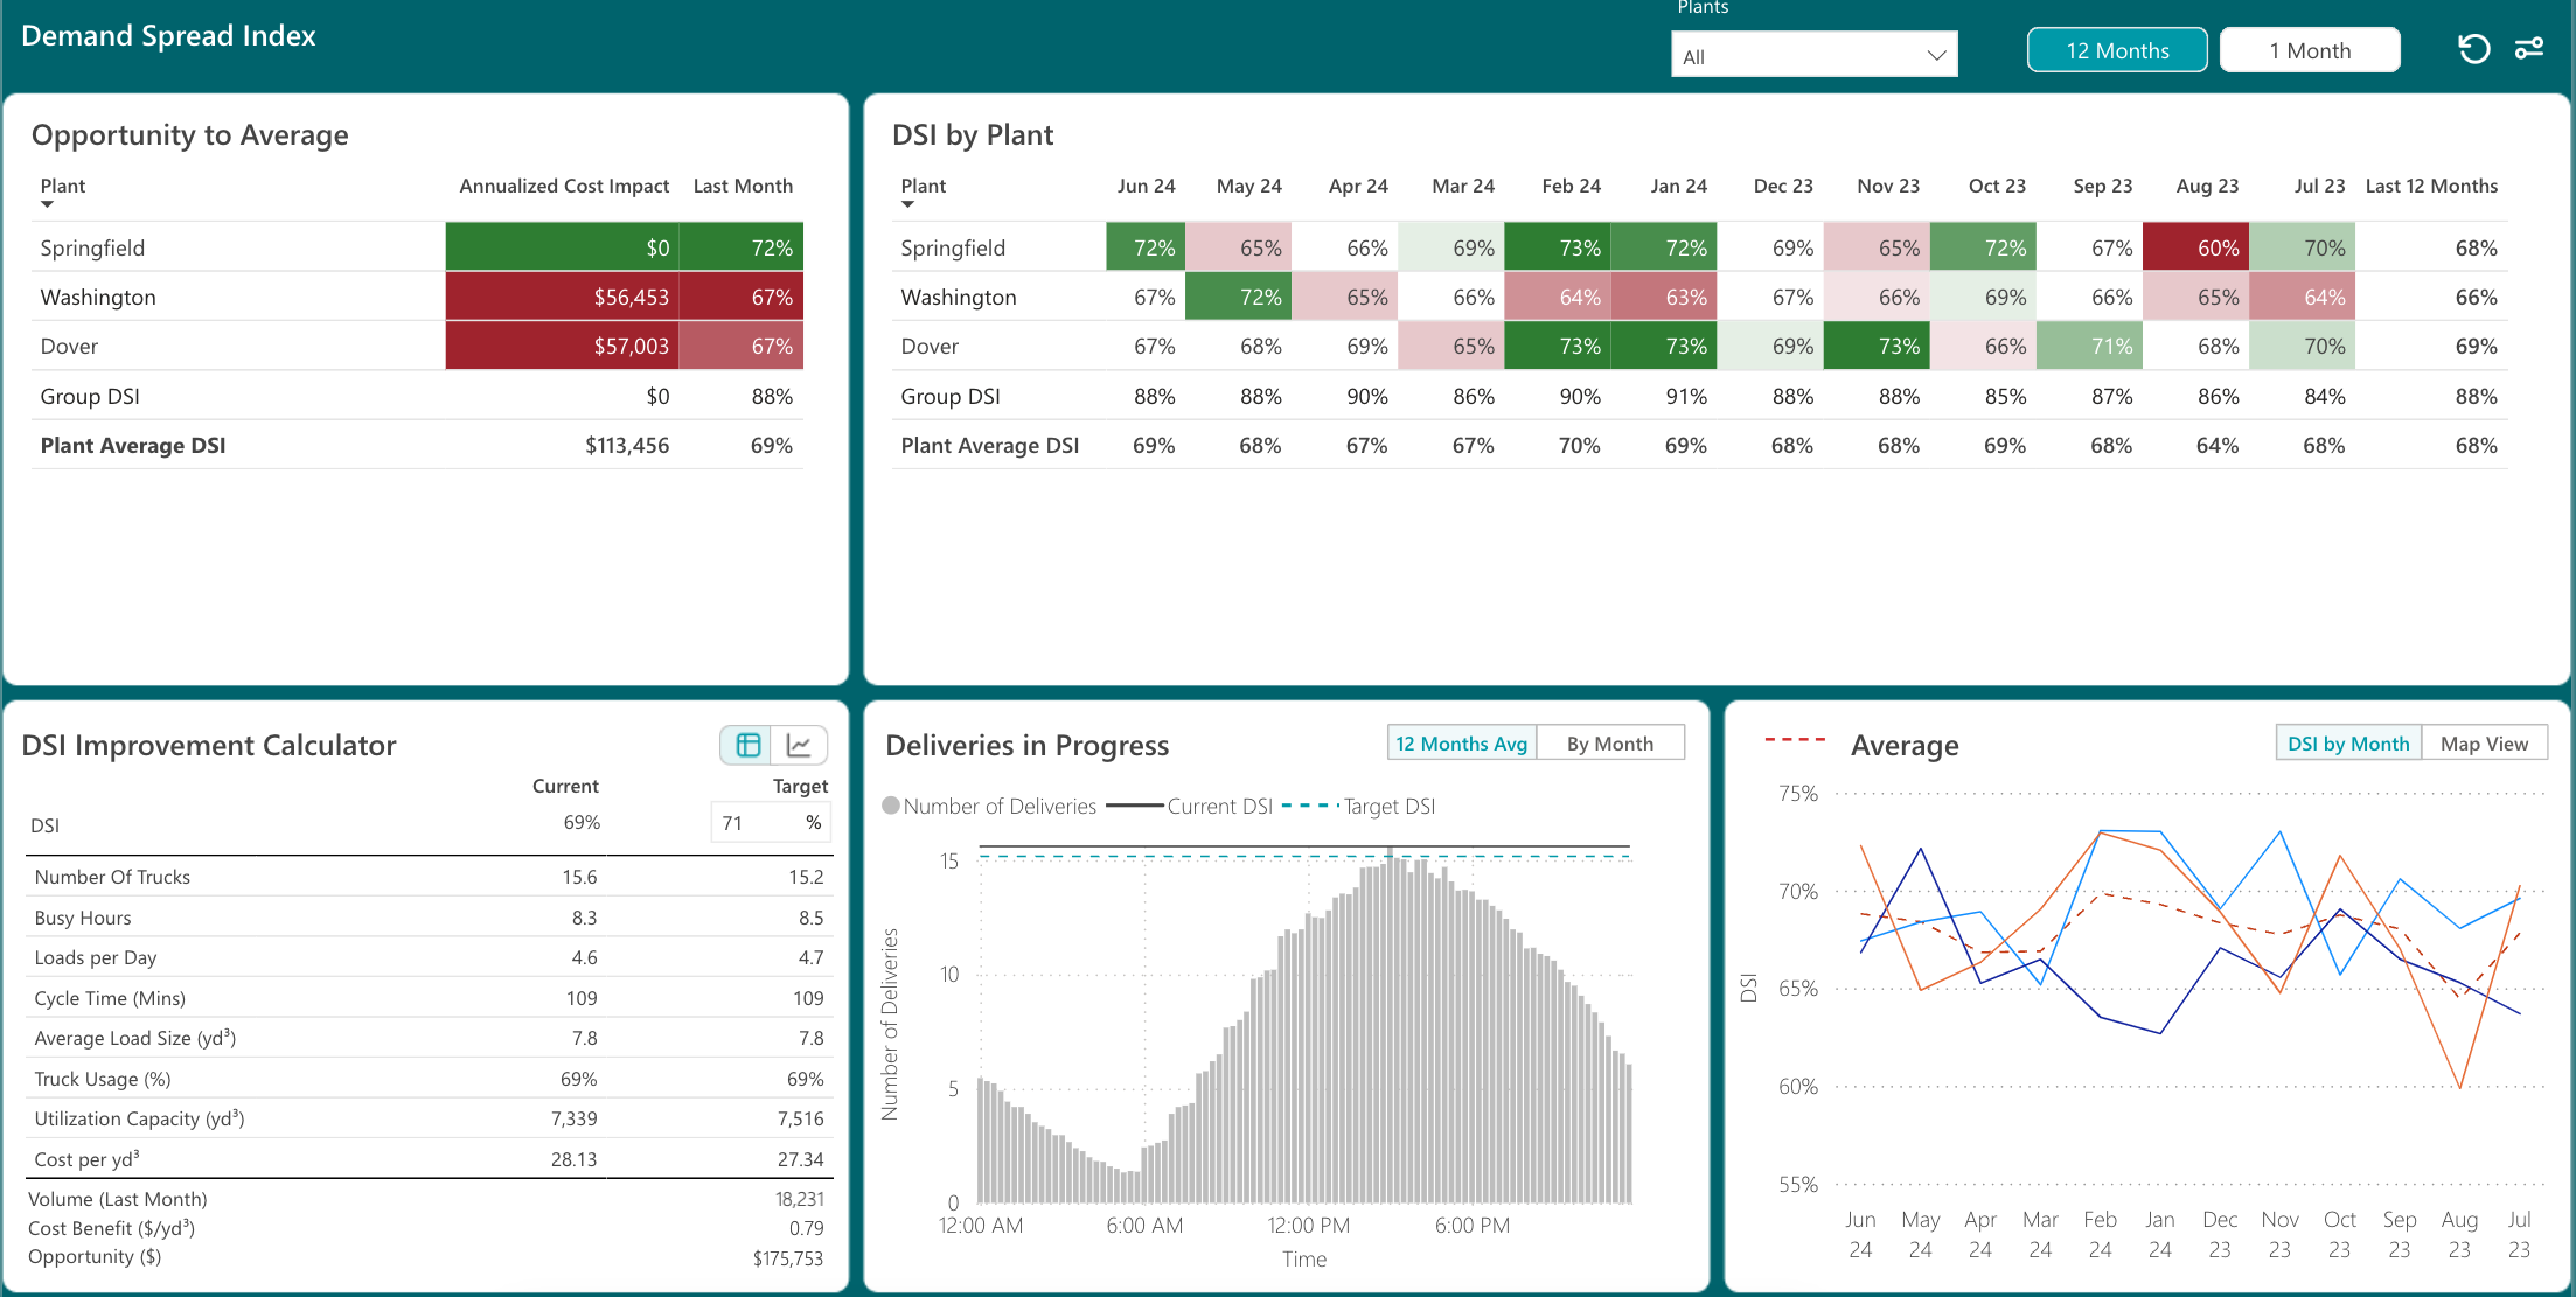
- Analyze how well you spread your workload during each day and uncover opportunities to utilize your fleet of trucks more effectively by reducing the peaks in demand.
Customer Delivery Performance: Yesterday's data and new graphs
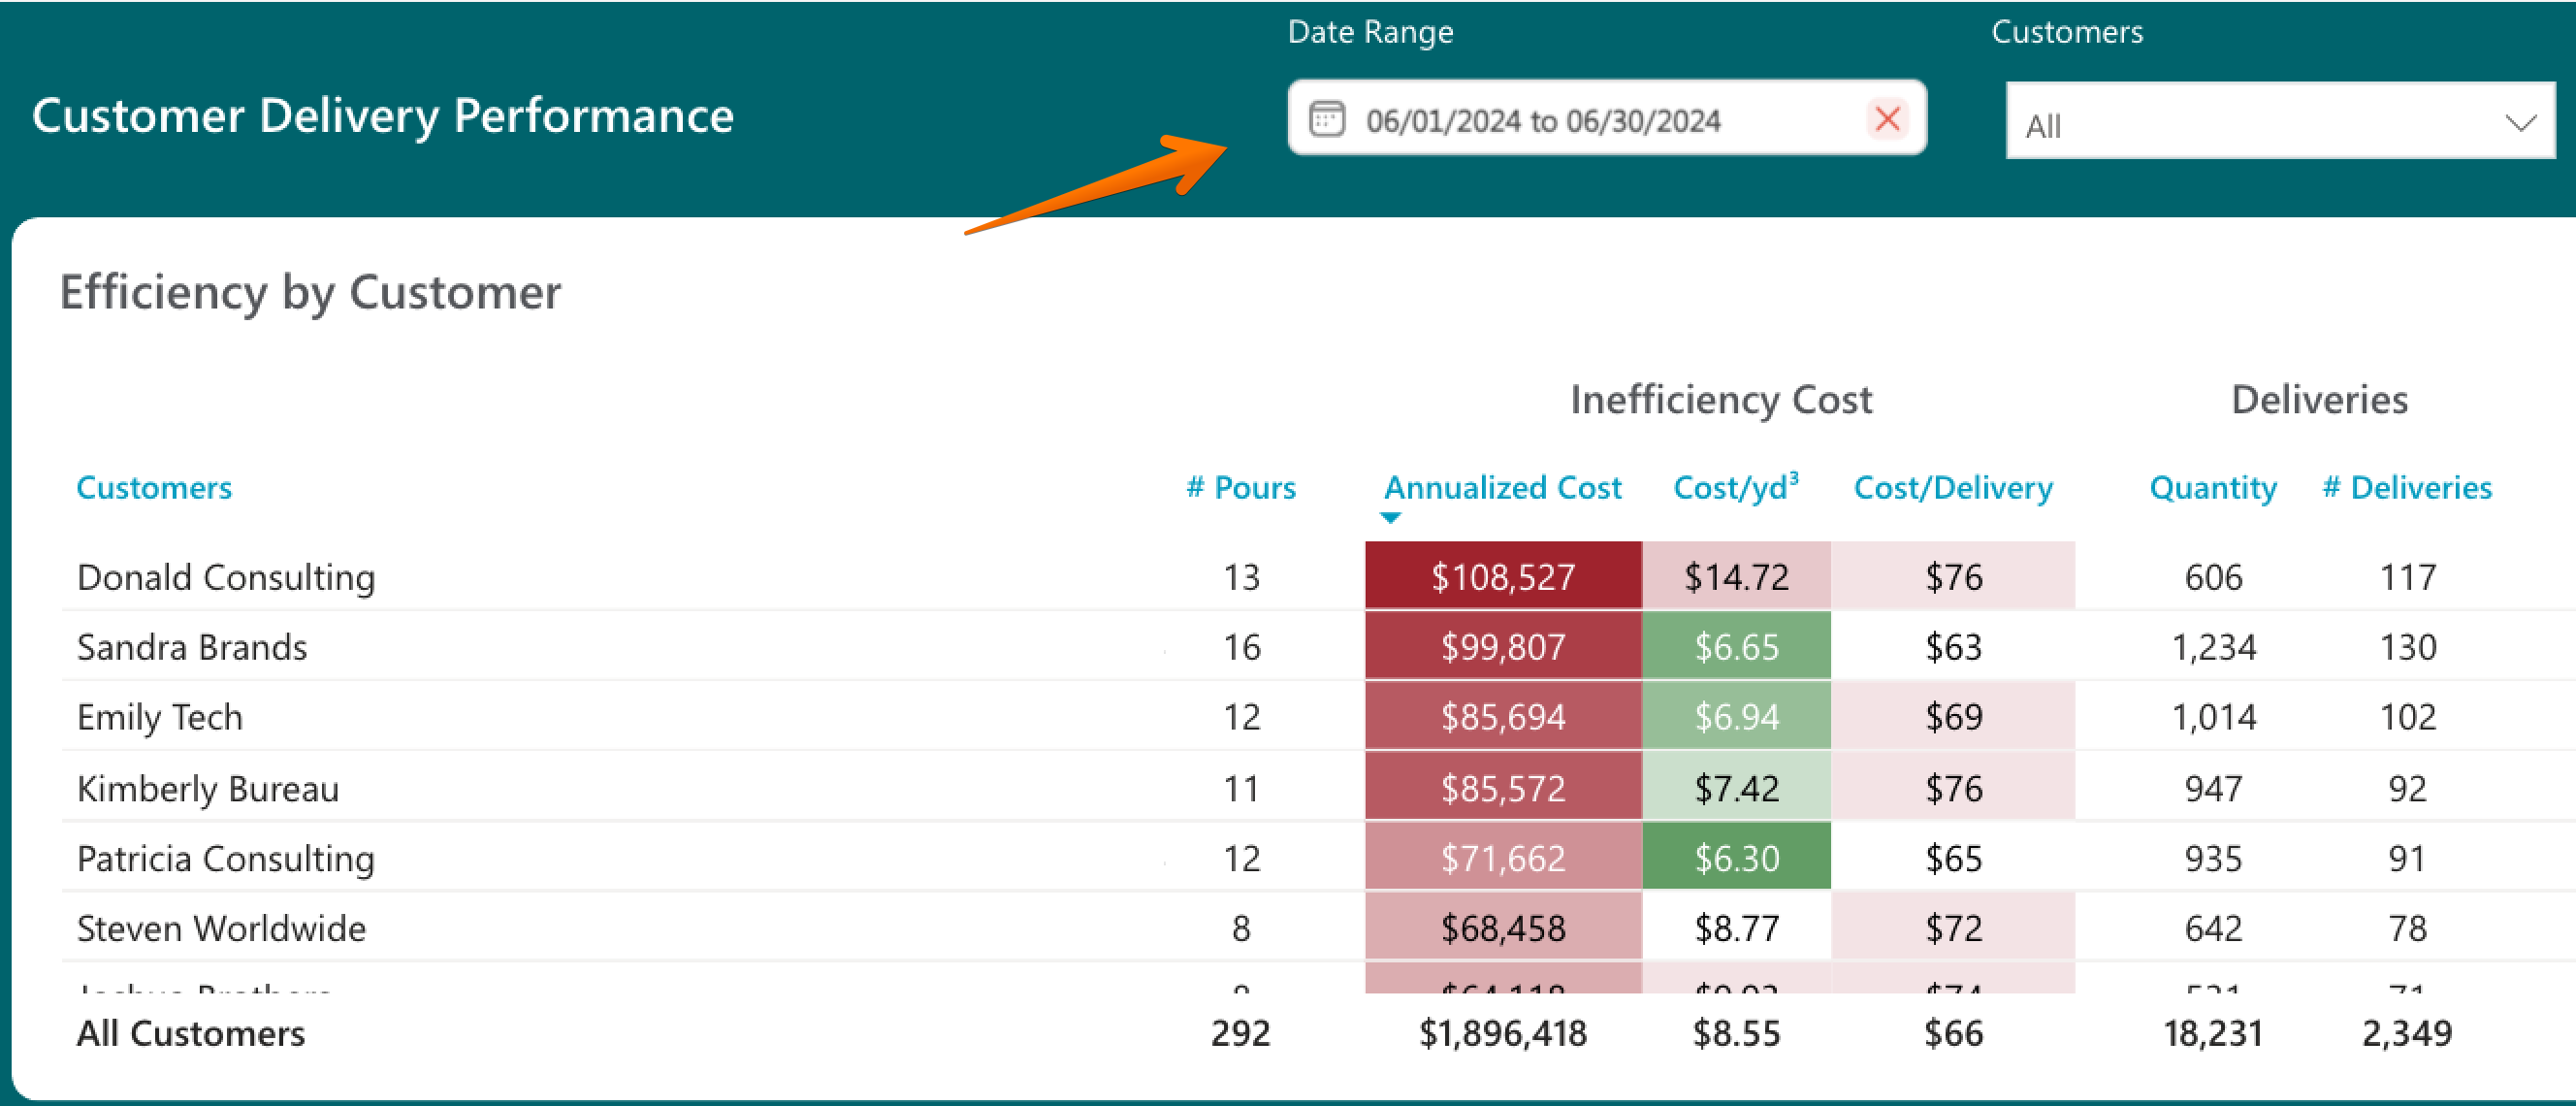
- Utilize the newly added date range selector within the customer delivery performance dashboard to look at yesterday's data
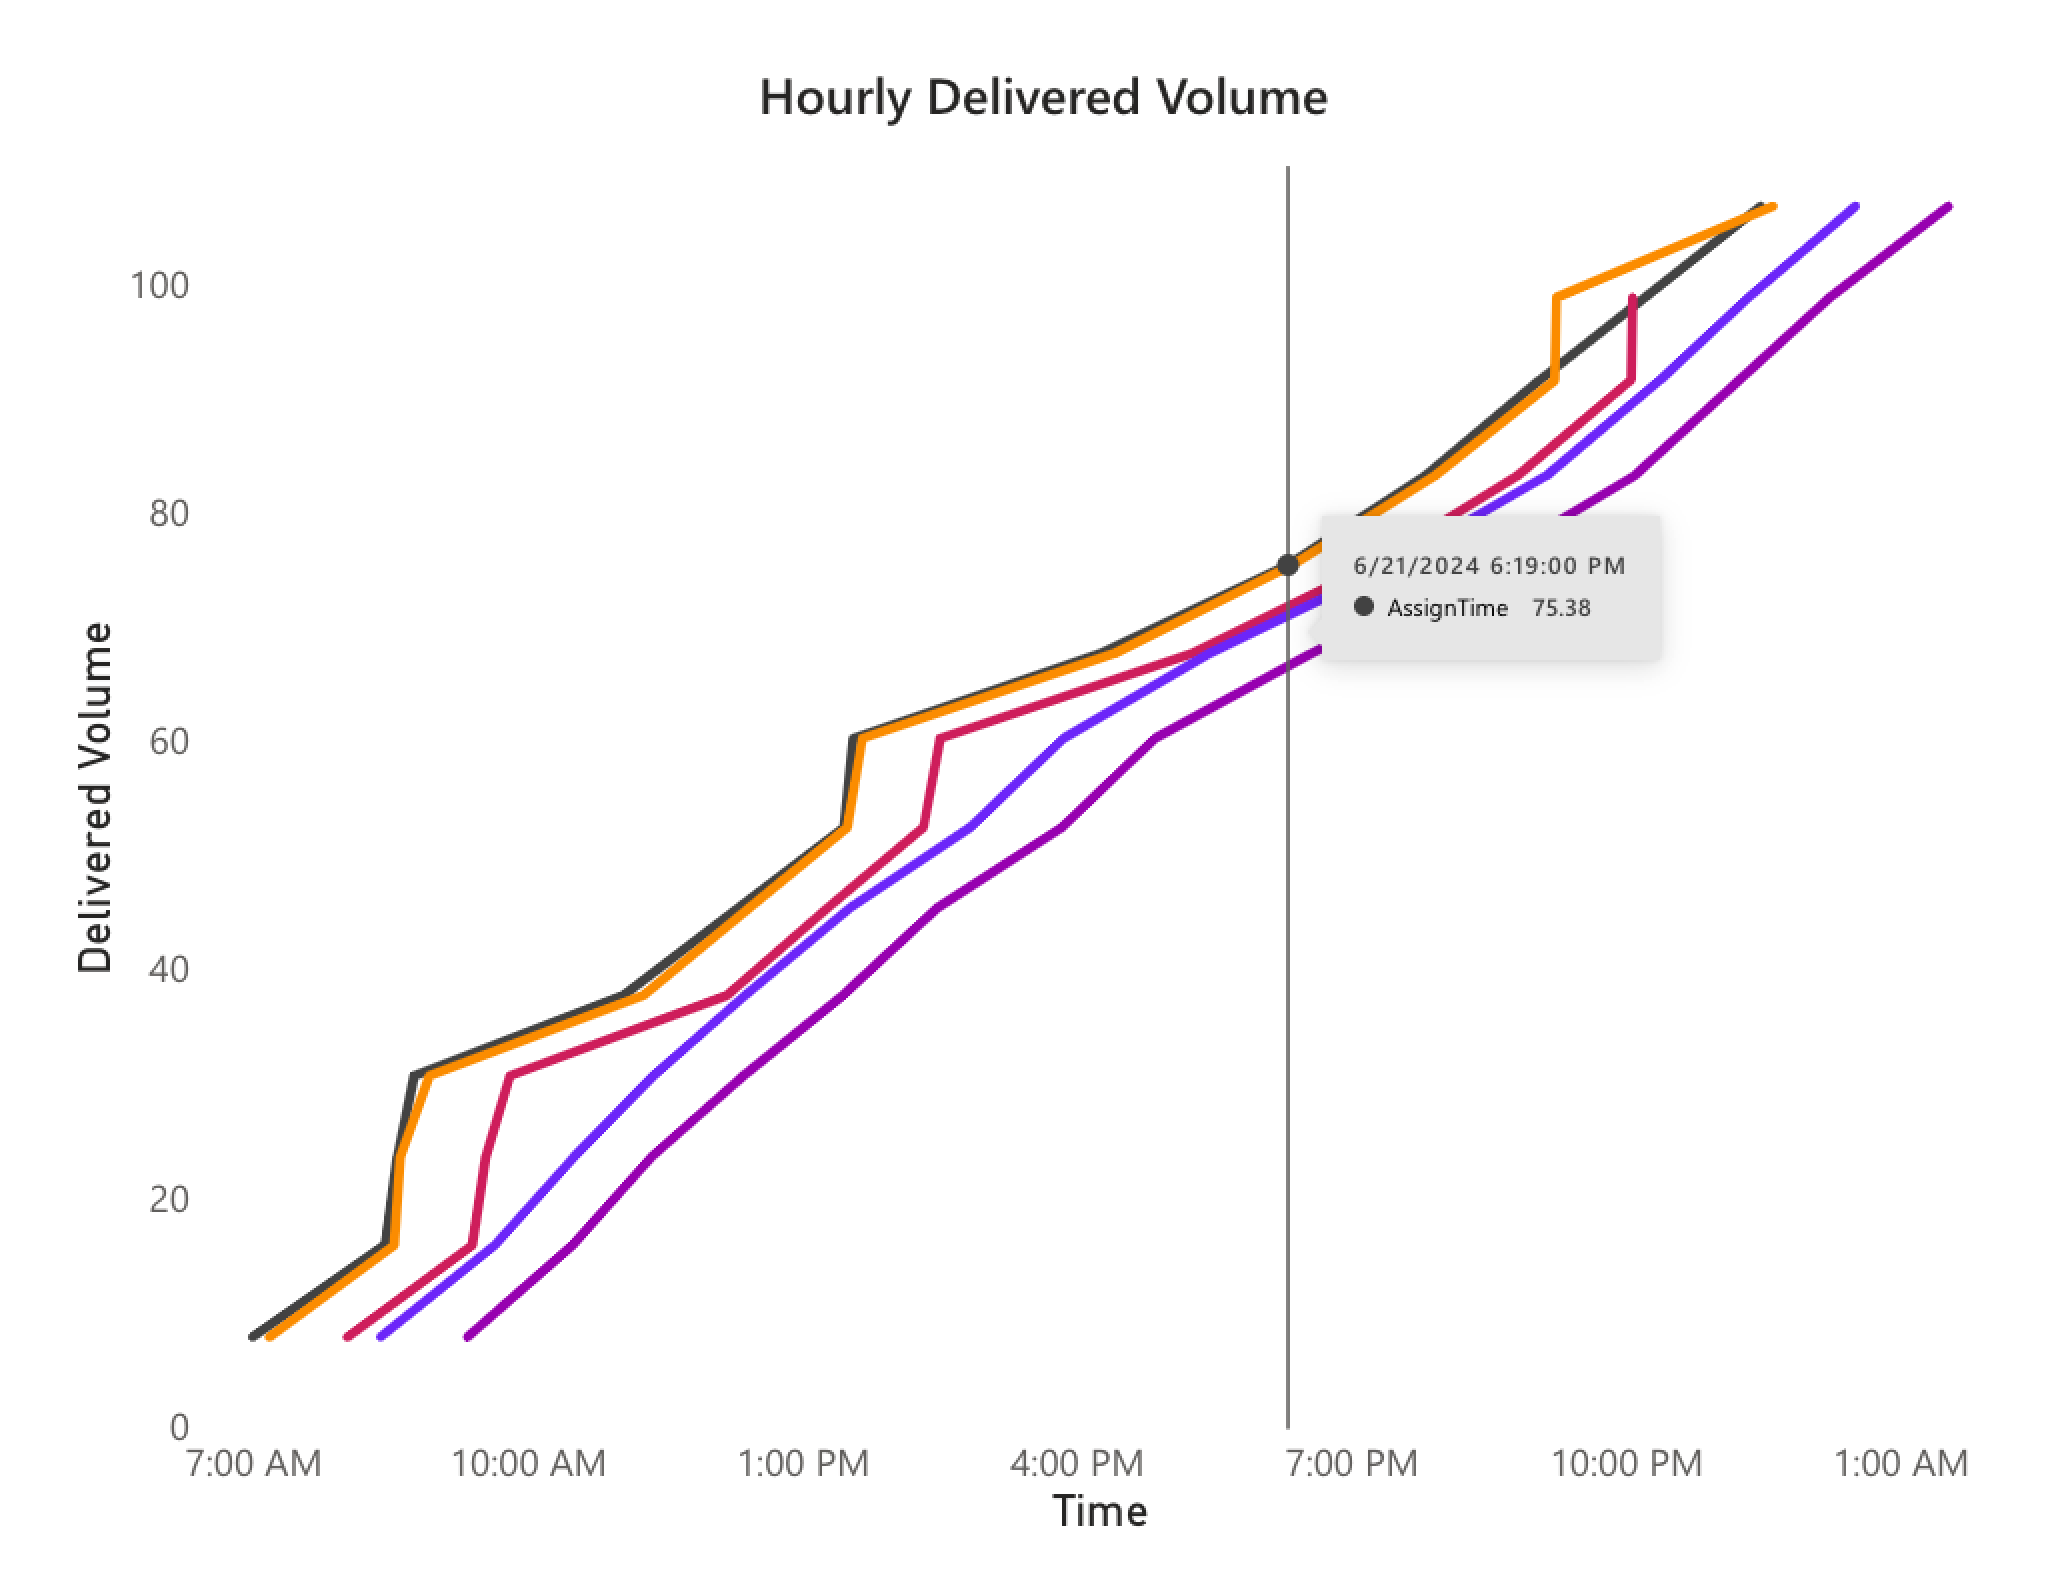
- Use the new flow charts to understand when you started over trucking or under trucking a pour
Batching Accuracy details
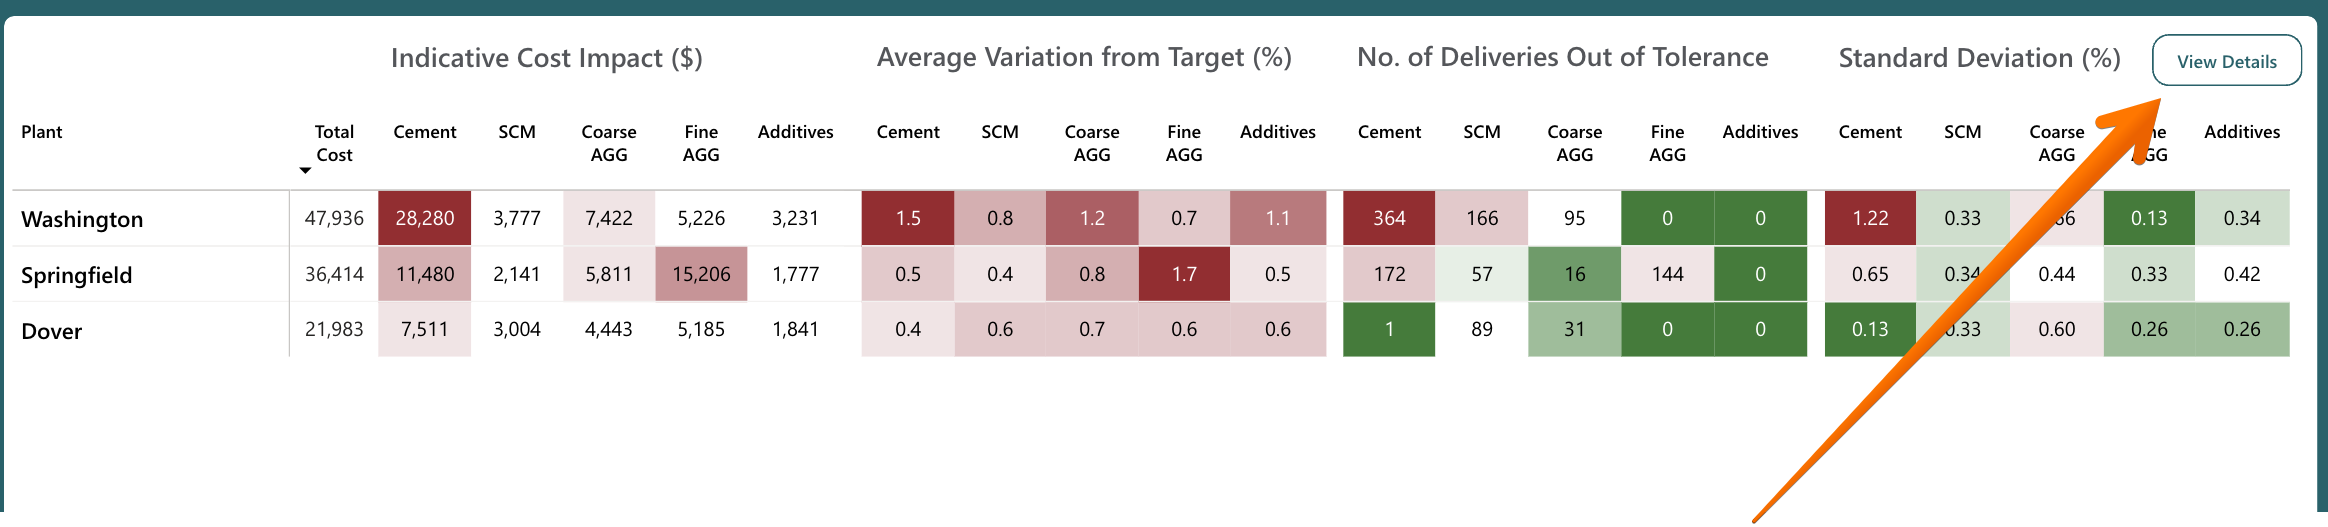
- Always wondered which deliveries were out of tolerance and what is the underlying data to our batching accuracy dashboard? You can now explore all the details and see the material, batch target, actual batched amount and more to truly understand the trends.
Status Accuracy Trends
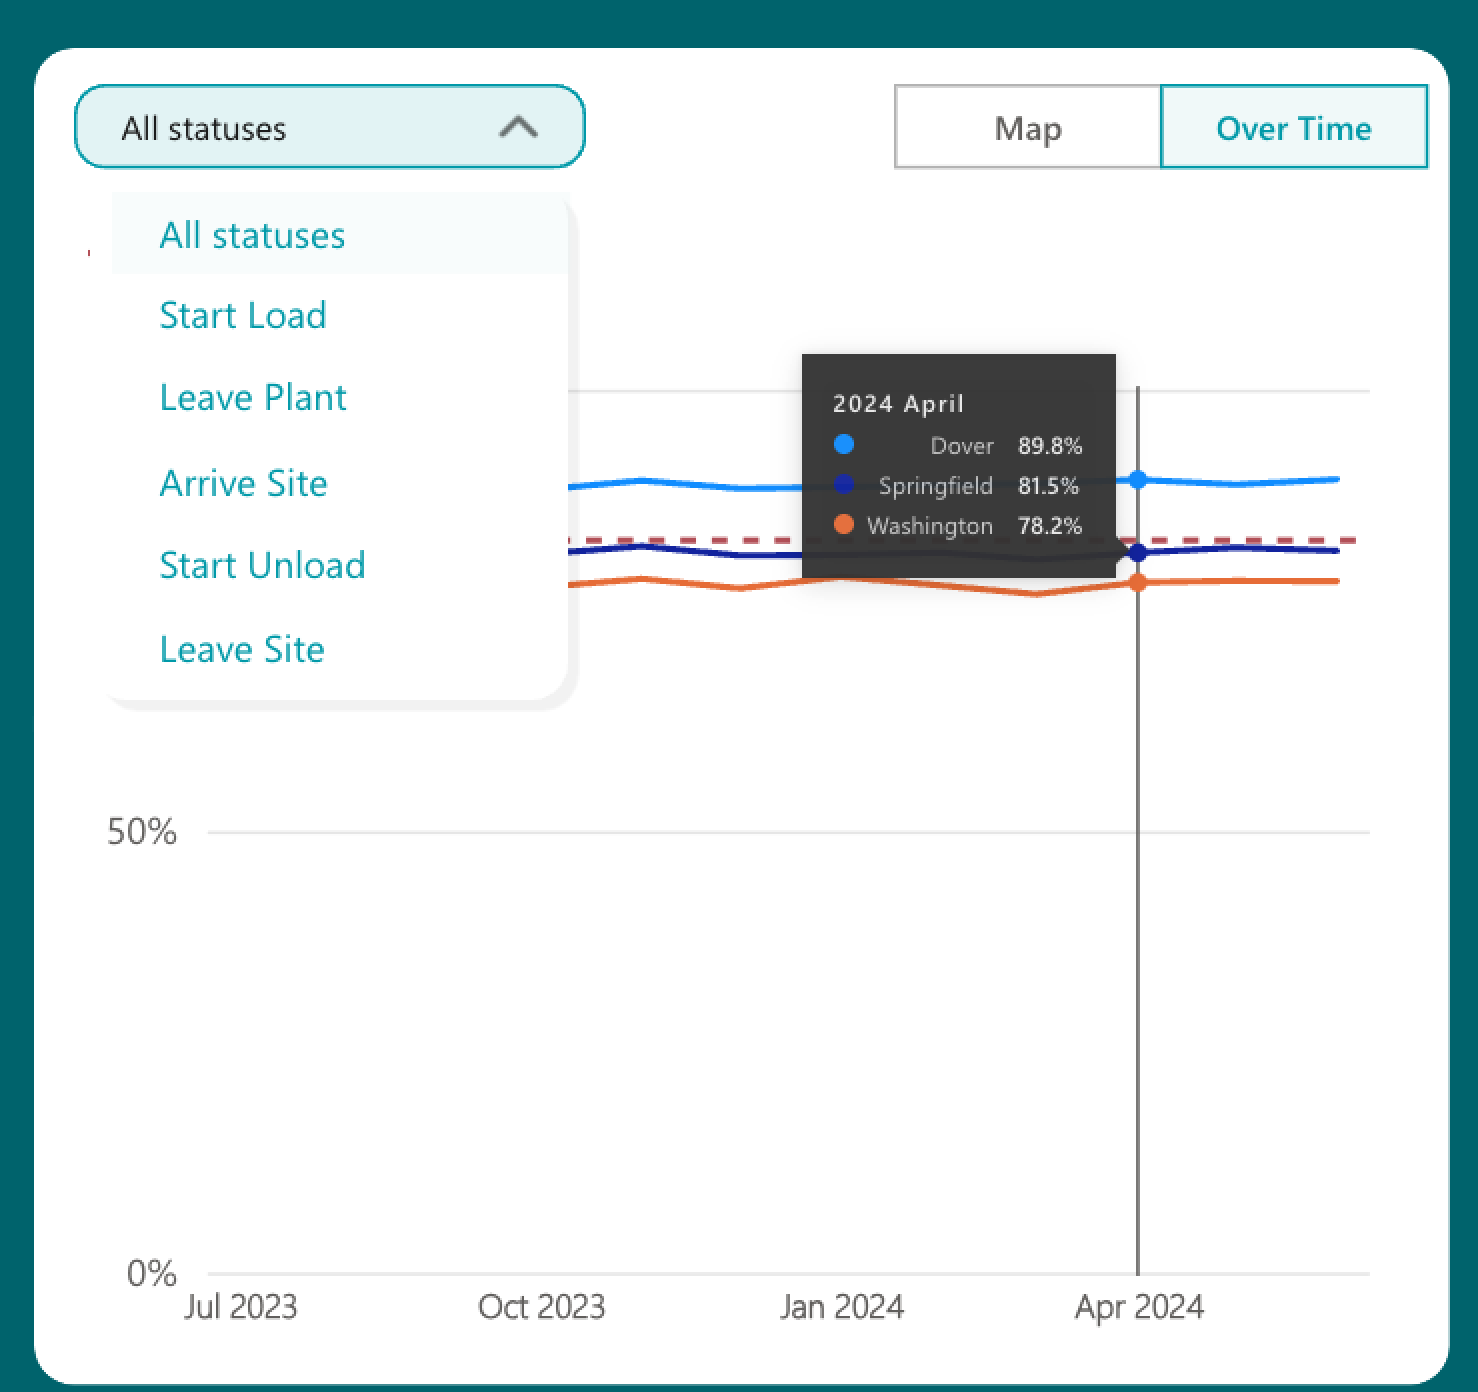
- Utilize the Status Accuracy over time graph to understand if you are getting better at status accuracy and which plants, job sites or trucks are improving the most